Intense battle between bulls and bears, lower channel boundary faces multiple challenges!

1. Weekly Market Review: (10.13~10.17)
This week, the index opened at 6622.53 points, hit a low of 6555.07 on Tuesday, reached a high of 6724.12 on Wednesday, and finally closed at 6664.01 points for the week, with a weekly increase of 1.70% and a fluctuation of 2.58%. The weekly candlestick closed as a bullish line, and technically, the index has regained the 5-week moving average.
This week, among the S&P 500 index constituents, Bunge led the gains with a 20.71% increase, while FFIV fell by 9.30%, ranking at the bottom. The average stock price of S&P constituents rose by 1.42%, and the average stock price of all US stocks increased by 0.43%.
From April 7 to October 17, the index has risen for 28 consecutive weeks, totaling 135 trading days, with a cumulative maximum increase of up to 39.91% during this period.
S&P 500 Weekly Chart: (Momentum Quantitative Model * Sentiment Quantitative Model)
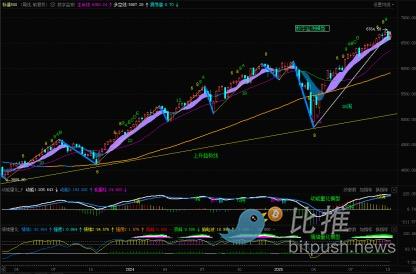
(Figure 1)
S&P 500 Daily Chart:
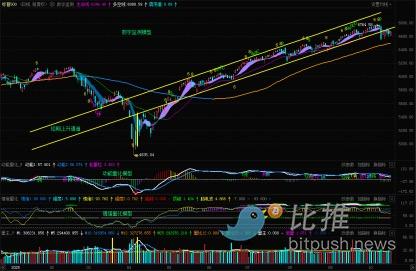
(Figure 2)
S&P 500 Weekly Chart: (Historical Data Backtest: March 6, 2009 to April 4, 2025)
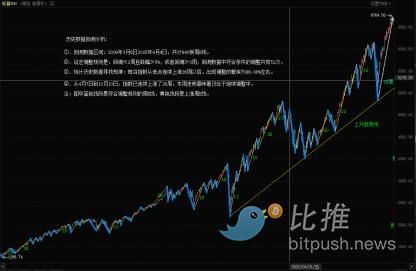
(Figure 3)
In the article on October 12, "S&P Index Adjusts as Expected, Observation Points: Adjustment Time and Space!", the author predicted this week's index trend based on multi-cycle technical indicator resonance and more than a decade of historical data backtesting, pointing out that the market had already experienced a significant adjustment and reminding investors that the main focus this week was to verify the effectiveness of the breakdown. The market forecast and operation strategy were as follows:
In terms of index trends:
• The 2.71% solid bearish candlestick closed last week constitutes an important technical breakdown. It was expected that the index would see a technical rebound at the beginning of this week to retest the validity of the breakdown at the lower boundary of the channel.
• The primary resistance above is near the original lower boundary of the channel; the first support below is at 6490 to 6550 points.
In terms of operation strategy:
• Total position: Long positions should be controlled below 30%.
• For short-term investors, it is recommended to mainly observe.
Now, reviewing the actual trend this week:
After the S&P index opened high at 6622.53 points this week, bulls and bears competed around the opening level, with a weekly fluctuation range of -1.03% to 1.53%, resulting in three bullish and two bearish candlesticks. From a technical perspective, the market attempted to rebound multiple times, but the highs of four consecutive trading days were blocked and fell back near the lower boundary of the channel, indicating that this key resistance is effective. The actual trend this week perfectly confirmed the author's prediction.
Next, the author will analyze the current changes in the index based on multi-model technical indicators.
(1) Quantitative Model Signal Analysis:
1. Weekly Perspective (see Figure 1):
① Momentum Quantitative Model: No signal was shown this week, and Momentum Line 1 is moving downward, gradually approaching Line 2.
Model indicates downside risk index: Neutral
② Sentiment Quantitative Model: Sentiment Indicator 1 strength is about 0.86 (range 0~10), Sentiment Indicator 2 strength is about 1.58, and the peak signal indicator is 9.51.
Model indicates downside risk index: Relatively high
③ Digital Monitoring Model: The weekly top turning point signal continues to be effective, and its persistence should be observed.
Model indicates downside risk index: High
2. Daily Perspective (see Figure 2):
① Momentum Quantitative Model: After the daily high-level bearish divergence signal formed, the two momentum lines continued to move downward, gradually approaching the zero axis.
Model indicates downside risk index: High
② Sentiment Quantitative Model: Both sentiment indicators are at 0, and the peak signal indicator is 0, indicating that the market's overbought sentiment has eased.
Model indicates downside risk index: In the process of declining
③ Digital Monitoring Model: The daily top turning point signal continues to be effective.
Model indicates downside risk index: High
(2) Trend Sequence and Historical Data Backtest Analysis (Figure 3):
1. Data Backtest Model Settings:
• Backtest data range: March 6, 2009 to April 4, 2025, a total of 840 weekly candlesticks.
• Adjustment rules: An effective adjustment is defined if any of the following conditions are met:
▪ Pullback period ≤ 2 weeks, and the decline is ≥ 5%;
▪ Pullback period ≥ 3 weeks (decline not limited).
▪ According to the above rules, a total of 52 effective adjustments were identified within the backtest period.
2. Core statistical pattern: Whenever the index rises continuously for 26 weeks from a low point, the probability of an adjustment is extremely high, about 98.08%.
3. Historical case evidence: In the past backtest data, the largest upward cycle occurred from July 19, 2017 to January 26, 2018, when the index rose for 29 consecutive weeks, followed by a decline of 13.43%; in addition, there were two other instances of significant adjustments after rising for 26 weeks.
4. From April 7 to October 3, the index has been rising for 26 consecutive weeks. According to historical data, the probability of an adjustment occurring afterwards is as high as 98.08%. The trend this week (the 28th week) indicates that the index is still in a technical adjustment phase.
2. Next Week's Market Forecast: (10.20~10.24)
1. Trend prediction: Next week will still test the validity of the breakdown below the channel's lower boundary. There are two possible outcomes: if the breakdown is valid, the adjustment will intensify; if it can regain stability, the oscillating upward trend will continue.
2. Key levels:
• Resistance above: Original channel lower boundary.
• Support below: First range 6490-6550 points; second range 6300-6340 points; important support range 6200-6147 points.
3. Next Week's Operation Strategy: (10.20~10.24)
1. Position management: Overall long positions should be controlled at 30%, and further operations should wait until the medium-term trend becomes clear.
2. Short-term trading: The market direction is still unclear and fluctuations will continue, so it is recommended to patiently observe.
3. Short-term techniques: For short-term operations, please refer to the 60/120-minute small cycle charts to improve the accuracy of entry and exit points.
4. Individual stock application: This strategy applies to overall position management and trading operations for individual stocks.
4. Special Reminder
For swing trading of individual stocks, whether buying long or short positions, set an initial stop-loss immediately after opening a position. When the stock price gains 5%, immediately move the stop-loss to the cost line (i.e., the breakeven point) to ensure that the trade will not lose money; when the profit reaches 10%, raise the stop-loss to the 5% profit level. Thereafter, every time the profit increases by 5%, the stop-loss should be raised by the same amount to dynamically protect realized profits.
(Note: The above 5% profit trigger threshold can be flexibly adjusted by investors according to their own risk preferences and the volatility of the underlying asset.)
5. Classic Case Analysis: (For case analysis only, not as investment advice)
No individual stock case analysis this week.
To cope with the ever-changing market, the author's operation strategy will remain dynamically adjusted. Investors who wish to obtain the latest information in a timely manner, please follow the link below.
Disclaimer: The content of this article solely reflects the author's opinion and does not represent the platform in any capacity. This article is not intended to serve as a reference for making investment decisions.
You may also like
Ripple’s $1B Acquisition of GTreasury Bolsters Treasury Management Solutions
Third Major Purchase of 2025: Ripple Expands Portfolio with $1B GTreasury Acquisition Following Hidden Road and Stellar Rail Deals

Who is the real "controller" behind the evaporation of $1.9 billion?

XRP Mirrors 2017 Setup as Falling Wedge Near $2.36 Signals Potential Breakout

Dogecoin (DOGE) Eyes $0.21 Breakout as RSI Momentum Confirms Bullish Continuation