Bull vs. Bear Showdown at $106,000! Is Bitcoin About to Find Its True Direction?

The price of bitcoin has shown characteristics of a key pivot level around $106,400, repeatedly acting as both support and resistance, influencing market trends and trading decisions. Summary generated by Mars AI. This summary is produced by the Mars AI model, and its accuracy and completeness are still in the process of iterative improvement.
Bitcoin has regarded $106,400 as a key pivot in this cycle, serving both as resistance and support.
The price has consolidated around this level multiple times, breaking through it after retesting and expanding into the next channel range; when the price falls below this level, it often requires a "repair period" before rising again.
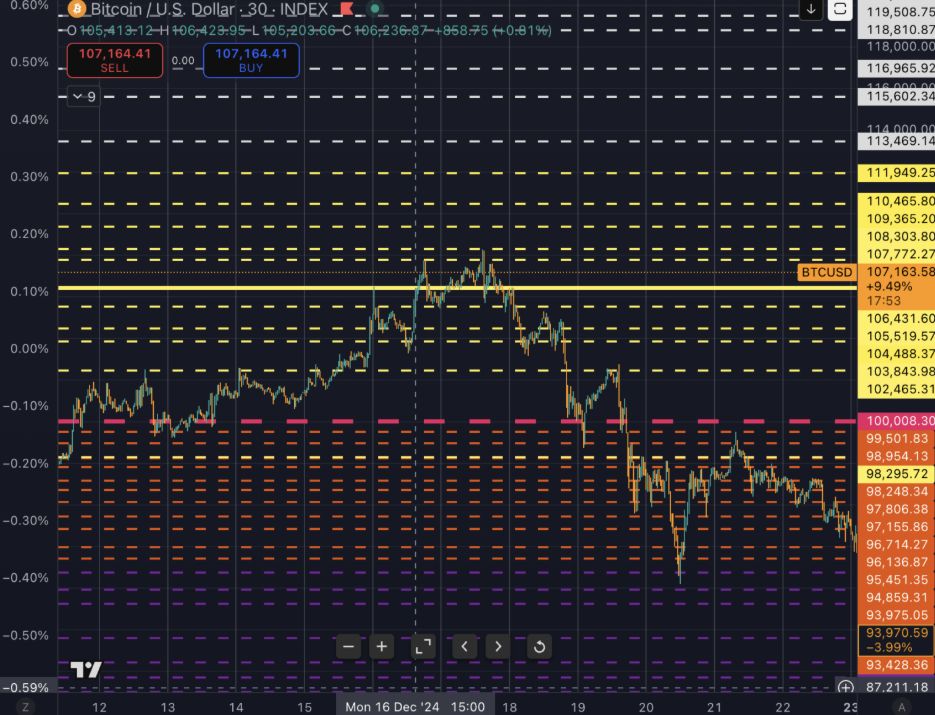
The chart below shows the most influential price channels for Bitcoin since the beginning of 2024, with $106,400 marked by a solid yellow line.
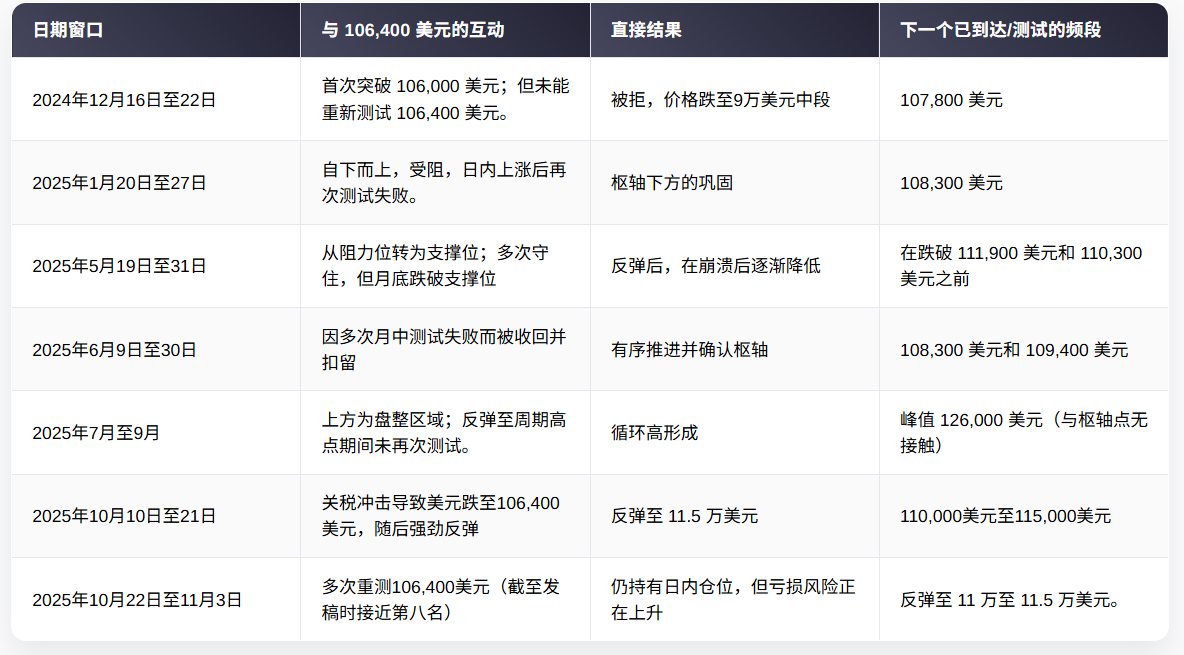
In mid-December 2024, after a sustained climb and breaking through the area just below $100,000, Bitcoin broke above $106,000 for the first time. After this level was breached, the price briefly surged to $107,800, but failed to hold above $106,400 on the retest, subsequently falling back to the mid-$90,000 range.
In late January 2025, Bitcoin exhibited a similar pattern, but with more frequent fluctuations. After rallying from below to $106,400, Bitcoin stalled, then extended intraday to the $108,300 range, but failed again on the retest.
Despite the noise within the channel, the inflection point at $106,400 continued to organize market movements—prices repeatedly fell back after touching this level.
This consistent behavior over several weeks makes this line an important reference for risk management.
By late May 2025, this relationship reversed. The price tested $106,400 twice from below and twice from above, then repeatedly used this level as support.
The rebound peaked at $111,900 and $110,300, but after the sixth retest, momentum waned and the price began to decline gradually.
During this phase, $106,400 acted like a "floor." As long as the closing price stayed above it, bears found it difficult to push the price into a lower channel. When this "floor" was finally lost at the end of the month, the repair cycle was noticeably prolonged, further confirming that losing this pivot changes the market rhythm.
In June 2025, $106,400 once again demonstrated its role in switching between support and resistance.
Mid-month, Bitcoin briefly fell below this level, then was rejected four times (with one intraday breakout above). By month-end, the price regained $106,400, stabilized at intraday highs several times, and further advanced to $108,300 and $109,400.
Each post-retest move was relatively orderly—this is a typical feature when the market respects a widely watched pivot. For traders waiting for confirmation at this line, if the price falls below $106,400 again, their entry logic is clearly invalidated; if the level holds, the target range in the upper channel becomes clear.
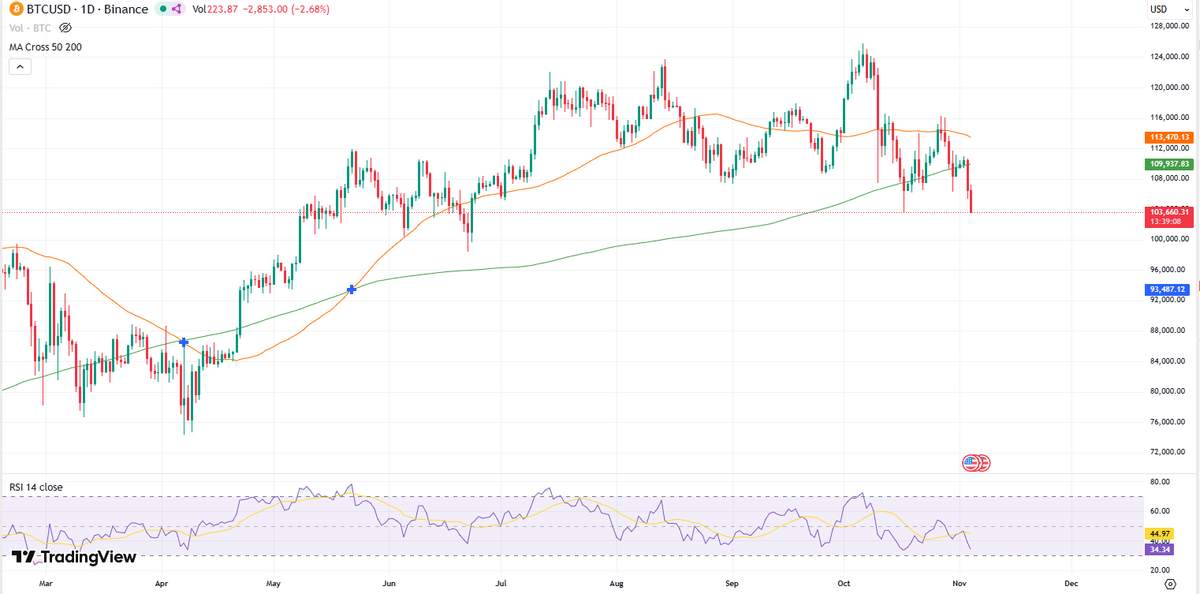
This pushed Bitcoin into a price discovery phase, ultimately setting a cycle high of $126,000. After that, it wasn't until the "Trump trade tariffs wiped out $19 billions" event on October 10 that Bitcoin retested $106,400.
The price action from October to early November 2025 showed another side.
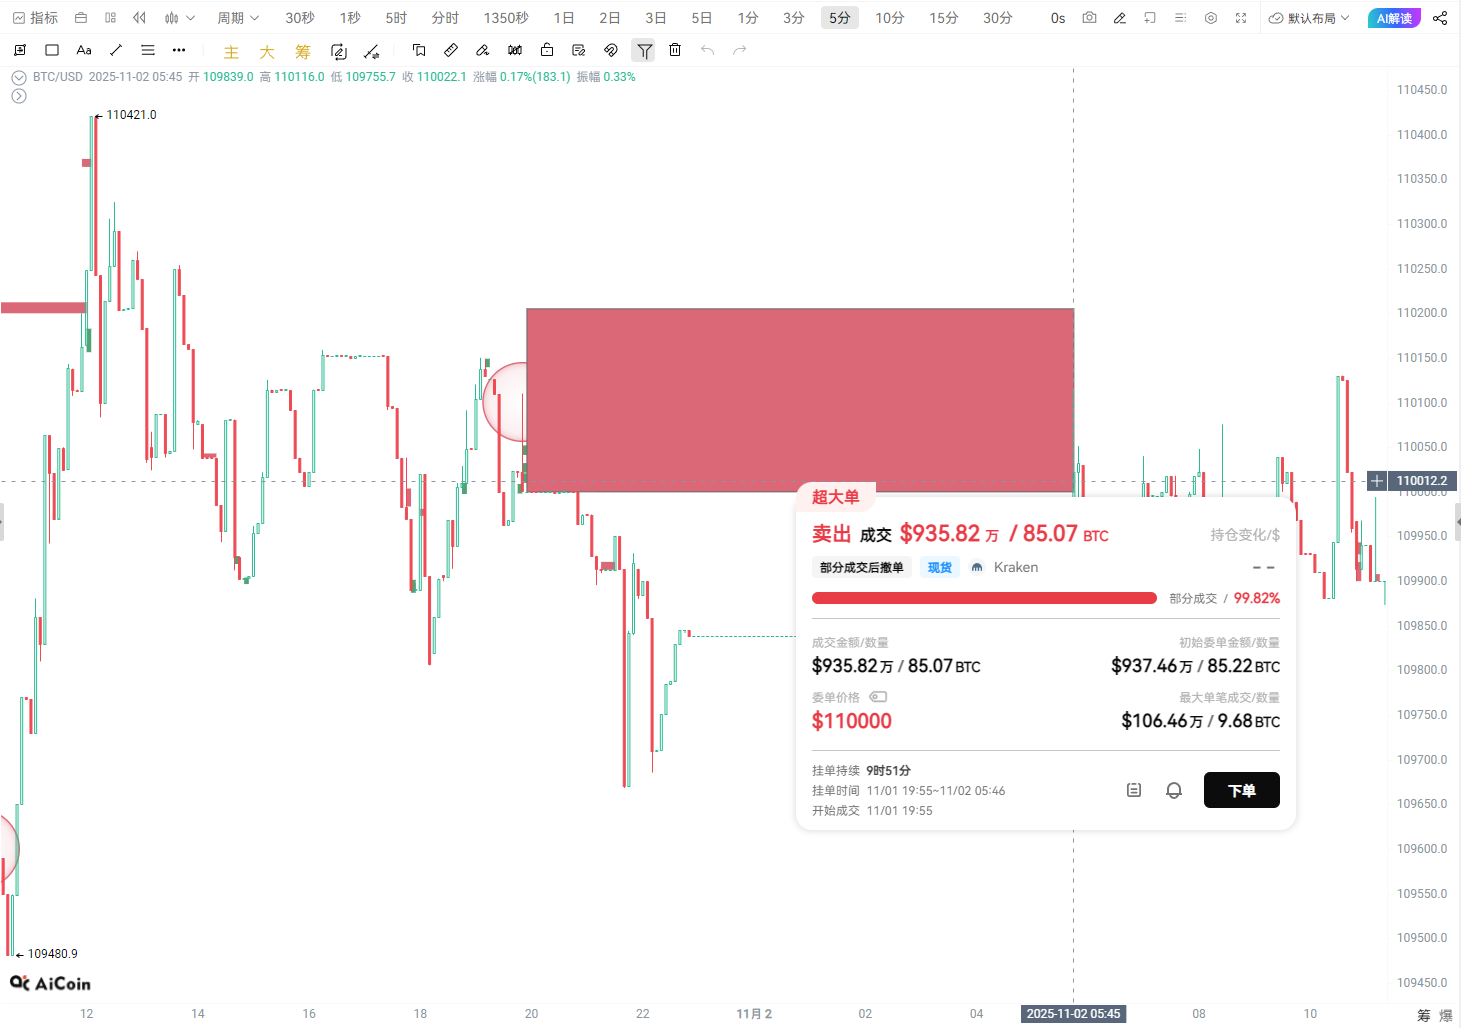
The price plunged sharply from its highs, quickly dropping to $106,400 before rebounding rapidly to $115,000. Bitcoin has repeatedly tried to stabilize at this pivot, and as of press time, it is approaching its eighth test.
So far, since touching the $126,000 high, every test of $106,400 has been followed by a rapid rebound to the $110,000 – $115,000 range.
What is concerning is that Bitcoin has never managed to hold $106,400 after eight consecutive retests before.
These repeated touches are significant because they compress a series of complex market variables into a single core reference point.
In the current chart framework, $106,400 roughly coincides with the median of the current channel group, meaning it sits near a "fair value" range—where buyer and seller liquidity is relatively balanced.
When the market "accepts" the price above this level, the path of least resistance shifts to the next higher range; when the price is rejected or falls below, the market often needs to rebuild volume and participation below before bulls can regain control.
From a series of chart snapshots, this pattern can be summarized as follows:
For traders who base their decisions on price ranges, the trading logic is actually quite straightforward
When the price breaks above $106,400 and is confirmed on a retest, the market's focus naturally shifts to a series of upper ranges: $107,800, $108,300, $109,400, and $110,500, which correspond to the dashed yellow steps in the chart.
If the price falls below this pivot again, the focus returns to the lower support ranges: $105,500, $104,500, and $103,800, which have repeatedly absorbed market liquidity during previous declines.
This framework does not predict direction—it defines more efficient execution zones and clearer stop-loss logic.
This level also helps traders find balance when momentum indicators or funding rate signals are contradictory.
- When momentum weakens but the price remains above $106,400, as long as the pivot holds, the upward channel remains open;
- When derivatives market positions are overcrowded but the price fails to reclaim this level, bears remain in control until the market "accepts" this price range again.
This provides a pragmatic approach to risk exposure management without over-relying on short-term indicators.
It is important to emphasize that this does not assign special status to a particular number, but is based on the fact that this price has been repeatedly validated in the current market structure. The market will evolve, and the pivot will migrate as distributions change.
However, the channels shown in the chart have effectively depicted intraday support and resistance zones over the past two years.
The value of $106,400 is reflected in the market's repeated returns to this price, the reactions formed around it, and the clear reference it provides for the next trading plan.
Therefore, $106,400 seems to be acting as the "balance point" of this cycle, and the price is indeed continuing to operate around this pivot.
Disclaimer: The content of this article solely reflects the author's opinion and does not represent the platform in any capacity. This article is not intended to serve as a reference for making investment decisions.
You may also like
BTC Falls Through Key Support. How Far Could Losses Go?
By sniping altcoins on DEX, we made a crazy profit of $50 million
A real story of getting rich in one year, growing from $50,000 to $50 million.

A Guide to Profiting in the Crypto Market During a Sentiment Shift
Project visibility, transaction speed, and early conviction are more important than patience.