Date: Thu, Nov 13, 2025 | 07:20 AM GMT
The cryptocurrency market is showing signs of strength as Ethereum (ETH) rebounded from its 24-hour low of $3,373 to around $3,540, marking a notable 3% jump. This rebound has lifted overall sentiment across the market, with several altcoins flashing green — including XRP (XRP), which appears to be setting up for a potential bullish continuation.
XRP has risen by over 4% today, and its chart is now highlighting a harmonic pattern that could signal the next upside wave if confirmed by key breakout levels.
 Source: Coinmarketcap
Cypher Harmonic Pattern in Play
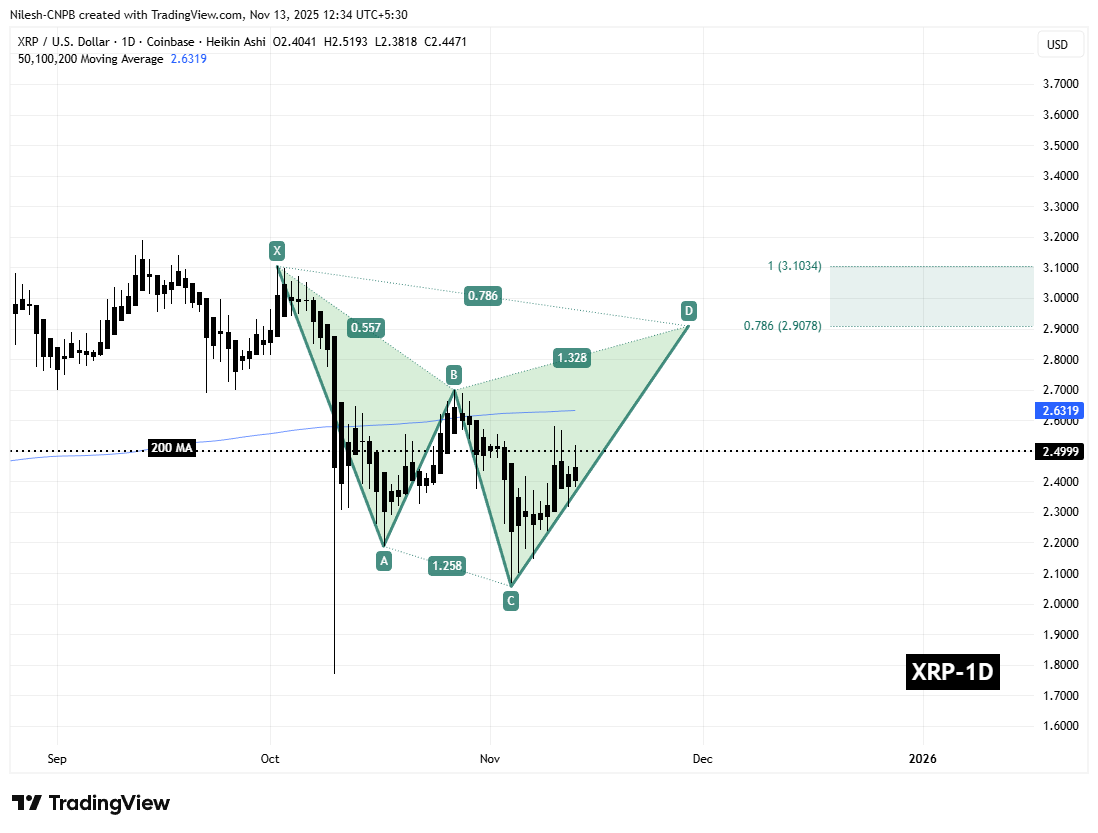
On the daily chart, XRP is forming a Bearish Cypher harmonic pattern — a structure that, despite its name, often delivers a bullish CD leg rally before the price reaches its Potential Reversal Zone (PRZ).
The pattern began at Point X ($3.1034), followed by a retracement to Point A, a rebound into Point B, and a sharp decline to Point C ($2.0562). From there, XRP started to bounce back and is currently trading near $2.50, showing renewed strength as buyers regain control.
 XRP Daily Chart/Coinsprobe (Source: Tradingview)
The 200-day moving average (MA) at $2.6319 now stands as the next critical resistance level. A clean breakout and sustained close above this mark could serve as a strong bullish confirmation, indicating that the CD leg of the pattern is expanding upward.
What’s Next for XRP?
If bulls successfully reclaim the 200 MA, the Cypher pattern’s projection suggests that XRP could rally further toward the PRZ, located between $2.9078 (the 0.786 Fibonacci extension) and $3.1034 (the 1.0 Fibonacci extension). These levels mark areas where the pattern typically completes — and where traders may begin watching for potential profit-taking or consolidation.
However, if XRP fails to hold above $2.38, it could lead to a short-term pullback or sideways movement, as buyers regroup and volume stabilizes before the next move.