
Coinglass report interprets Bitcoin's "life-or-death line": 96K becomes the battleground between bulls and bears—Is the ETF capital withdrawal an opportunity or a trap?

Bitcoin's price remains stable above the real market mean, but the market structure is similar to Q1 2022, with 25% of supply currently at a loss. The key support range is between $96.1K and $106K; breaking below this range will increase downside risk. ETF capital flows are negative, demand in both spot and derivatives markets is weakening, and volatility in the options market is underestimated. Summary generated by Mars AI. The accuracy and completeness of this summary are still being iteratively updated by the Mars AI model.
Summary
- Bitcoin remains above the True Market Mean, but the broader market structure now resembles Q1 2022, with over 25% of supply in a loss position.
- Capital momentum remains positive, supporting consolidation, although it is far below the mid-2025 peak.
- The 0.75–0.85 quantile range ($96.1K–$106K) is a key area for restoring market structure; a break below would increase downside risk.
- ETF fund flows have turned negative, and spot cumulative volume delta (CVD) has declined, indicating weakening demand.
- Futures open interest is falling, and funding rates have reset to neutral, reflecting a risk-averse stance.
- The options market is showing implied volatility (IV) compression, softening skew, and a shift in flows from put buying to cautious call selling.
- Options appear undervalued, with realized volatility exceeding implied volatility, putting pressure on short-gamma traders.
Overall, the market remains fragile and depends on holding key cost basis areas unless a macro shock disrupts the balance.
 On-chain Insights
Bottoming or Collapse?
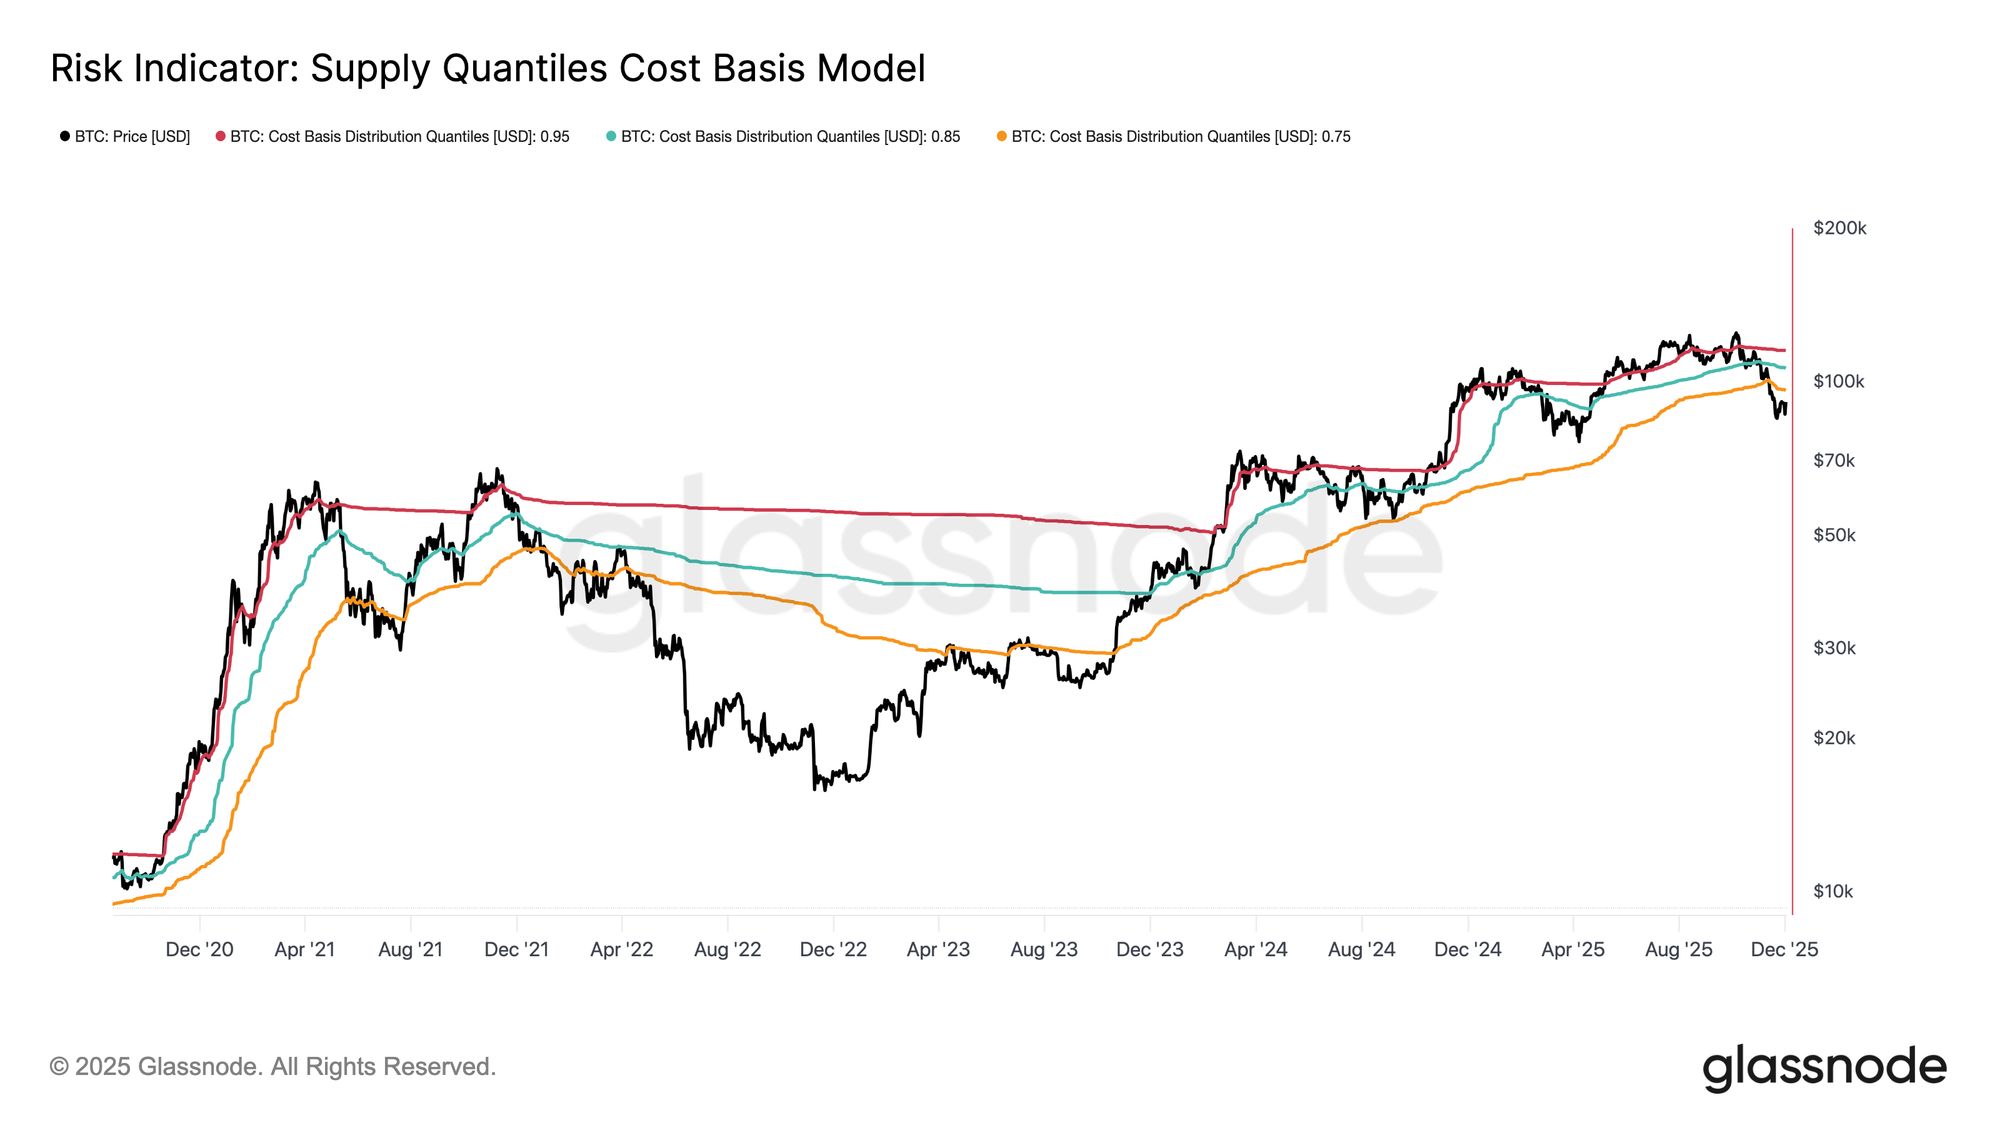
Over the past two weeks, Bitcoin's price has declined and found support near a key valuation anchor known as the True Market Mean—the cost basis of all non-dormant coins (excluding miners). This level typically marks the boundary between a mild bearish phase and a deep bear market. Although the price has recently stabilized above this threshold, the broader market structure is increasingly echoing the dynamics of Q1 2022.
Using the Supply Quantiles Cost Basis Model (which tracks the cost basis of supply clusters held by top buyers), this similarity becomes even clearer. Since mid-November, the spot price has fallen below the 0.75 quantile and is currently trading near $96.1K, putting over 25% of supply in a loss position.
This creates a fragile balance between the risk of capitulation by top buyers and the potential for a bottom formed by seller exhaustion. However, until the market can reclaim the 0.85 quantile (around $106.2K) as support, the current structure remains highly sensitive to macro shocks.
Pain Dominates
Based on this structural perspective, we can zoom in on the supply held by top buyers using the "Total Supply in Loss" metric to gauge the dominance of losses, i.e., unrealized pain.
The 7-day simple moving average (7D-SMA) of this metric climbed to 7.1 million BTC last week—the highest level since September 2023—highlighting that more than two years of bull market price expansion is now facing two shallow bottoming phases.
The current scale of supply in loss (between 5 million and 7 million BTC) is strikingly similar to the sideways market of early 2022, further reinforcing the similarity noted above. This comparison again emphasizes that the True Market Mean is a key threshold distinguishing a mild bearish phase from a transition to a more definitive bear market.

Momentum Remains Positive
Despite the strong similarity to Q1 2022, capital momentum flowing into Bitcoin remains slightly positive, helping to explain the support near the True Market Mean and the subsequent rebound above $90K.
This capital momentum can be measured by the Net Change in Realized Cap, which is currently at +$8.69 billion per month—well below the July 2025 peak of $64.3 billion/month, but still positive.
As long as capital momentum stays above zero, the True Market Mean can continue to serve as a consolidation and potential bottoming area, rather than the start of a deeper decline.

Long-term Holder Profit Margins Shrink
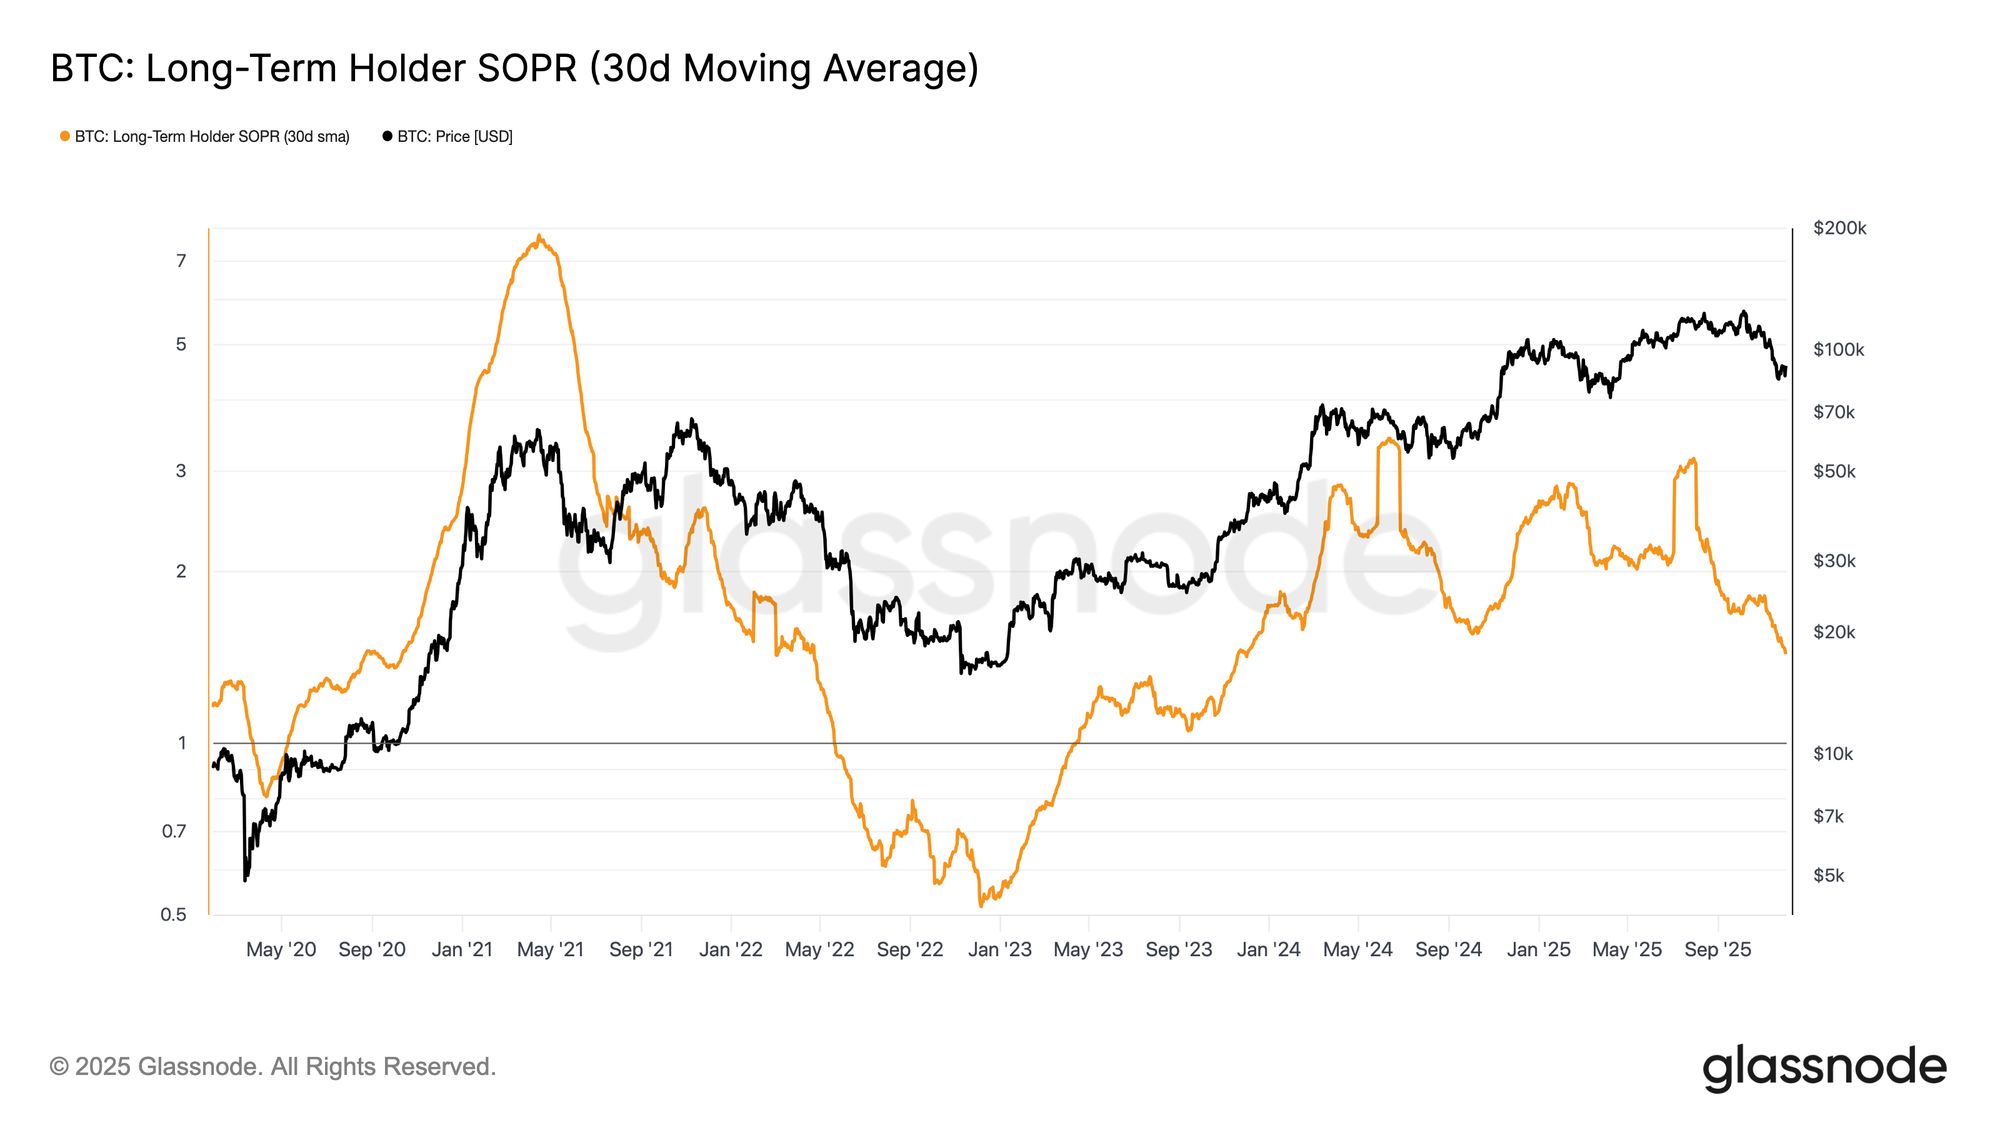
Remaining in a regime of positive capital inflows means new demand can still absorb profit-taking by long-term investors. The long-term holder SOPR (30D-SMA, measuring the ratio of spot price to cost basis for active spending by long-term holders) has dropped sharply with the price but remains above 1 (currently at 1.43). This emerging profit margin trend again echoes the structure of Q1 2022: long-term holders continue to sell at a profit, but margins are narrowing.
Although demand momentum was stronger in early 2022, liquidity continues to decline, requiring bulls to defend above the True Market Mean until a new wave of demand enters the market.
Off-chain Insights
ETF Demand Weakens
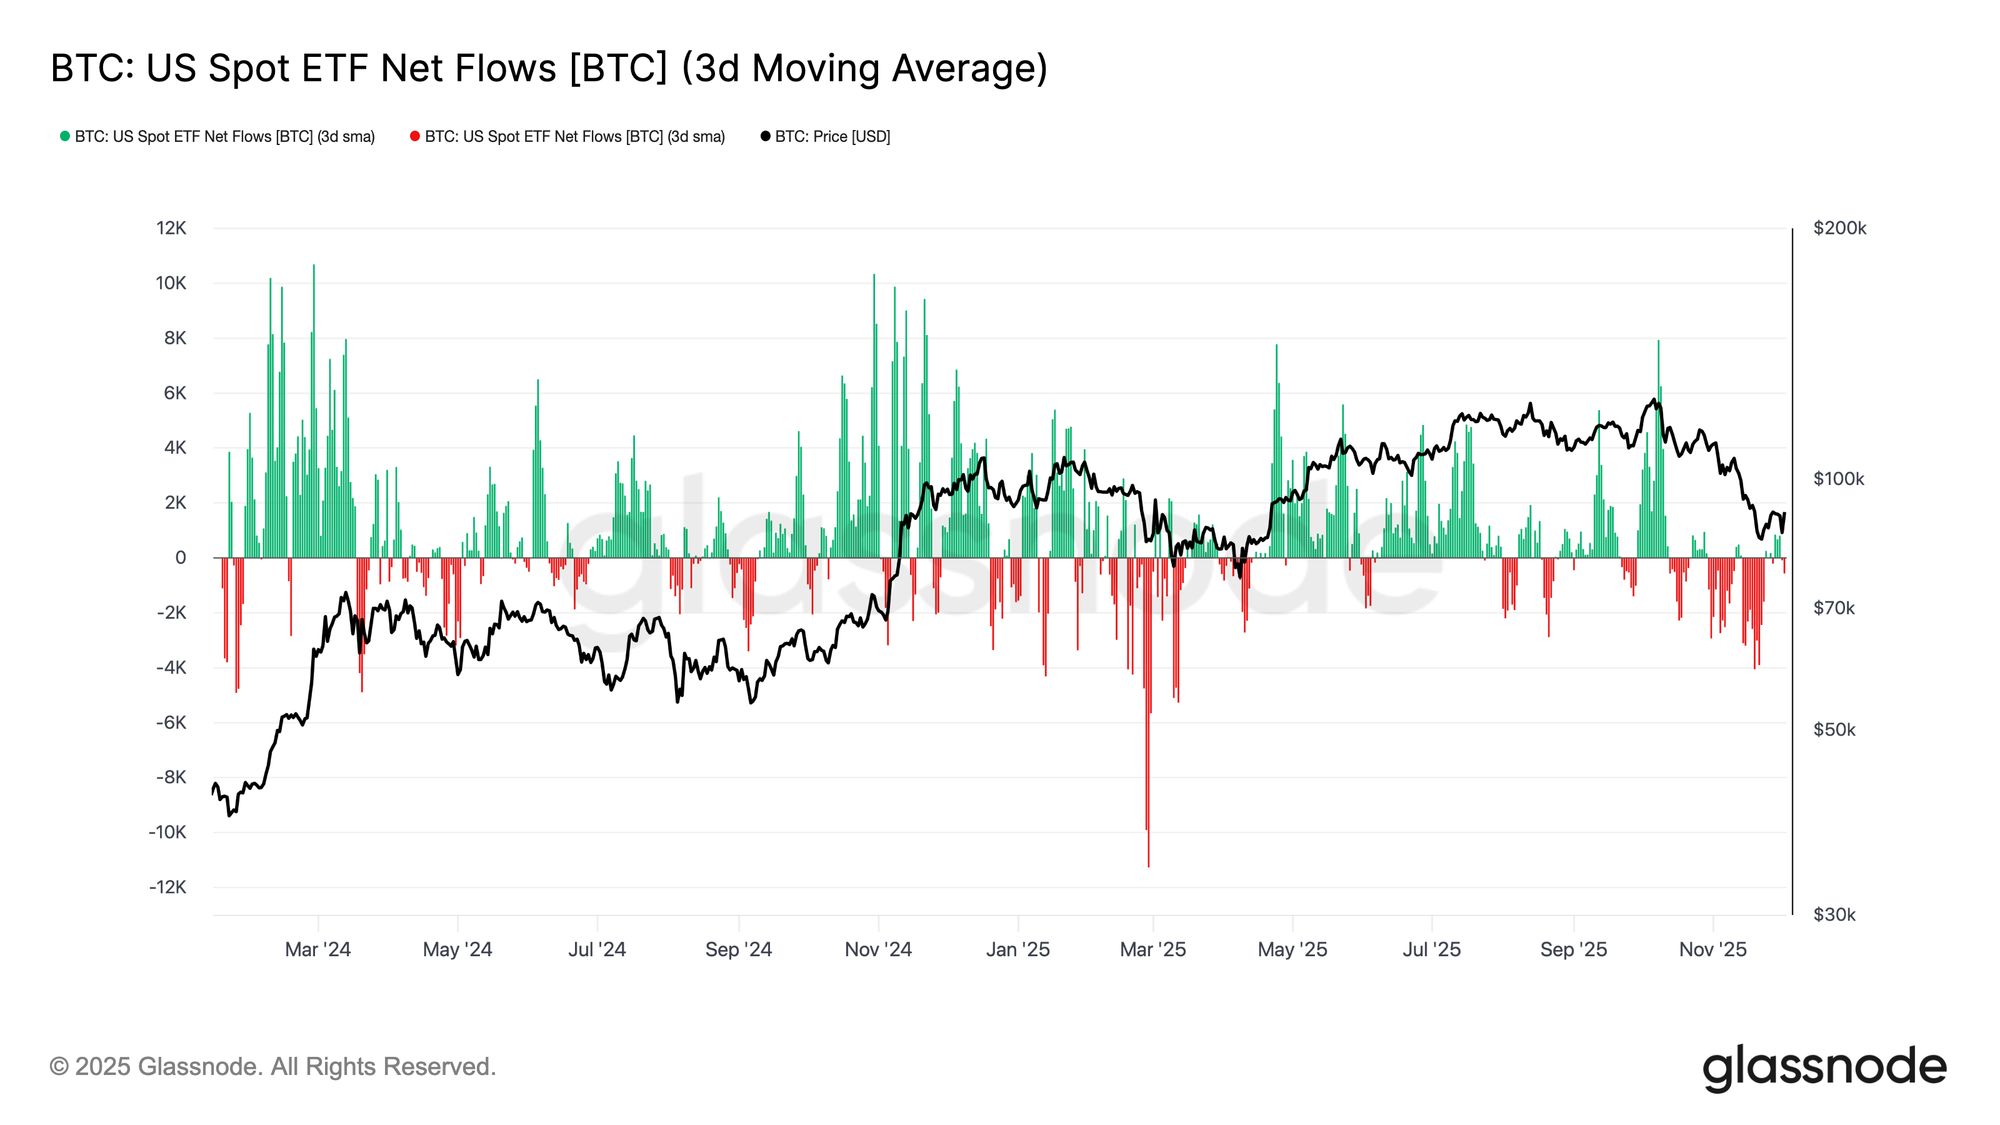
Turning to the spot market, net inflows into US Bitcoin ETFs have deteriorated significantly, with their 3-day average firmly sliding into negative territory throughout November. This marks a break from the sustained inflows that supported prices earlier this year, reflecting a cooling of new capital allocation.
Outflows are broadly distributed across issuers, indicating that institutional participants have adopted a more cautious stance as market conditions weaken. The spot market now faces a backdrop of weakening demand, undermining immediate buy-side support and making prices more sensitive to external shocks and macro-driven volatility.
Spot Buying Weakens
On top of deteriorating ETF demand, cumulative volume delta (CVD) on major exchanges has also declined, with both Binance and aggregate trading platforms showing a persistent negative trend.
This indicates steadily increasing sell pressure driven by market orders, with traders crossing the spread to reduce risk rather than accumulate. Even Coinbase, typically seen as a barometer of US buy-side strength, has flattened, indicating a broad retreat in spot conviction.
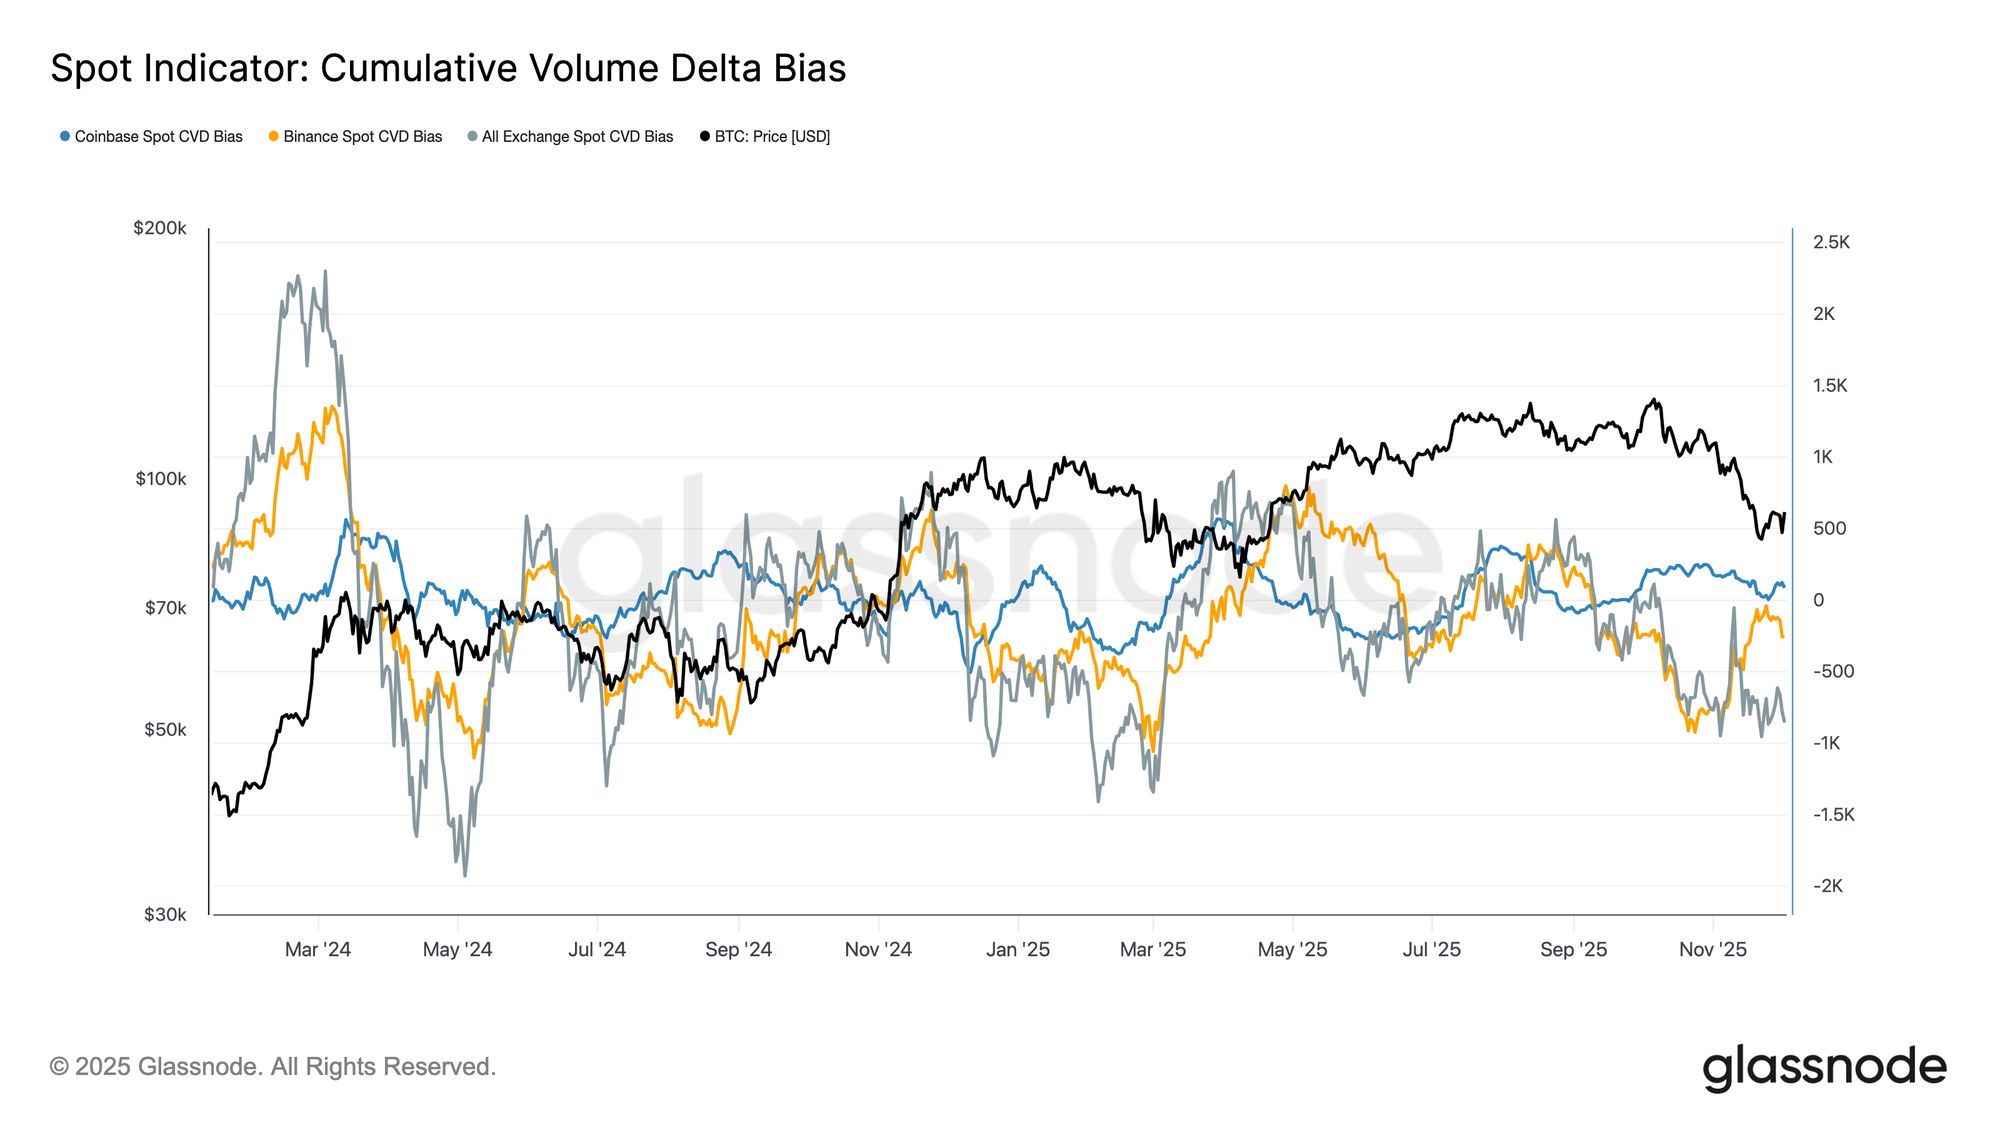
With ETF flows and spot CVD turning defensive, the market now relies on a weaker demand base, making prices more vulnerable to continued declines and macro-driven volatility.
Open Interest Continues to Decline
Extending this weakening demand trend to the derivatives market, futures open interest has continued to decline steadily through late November. While the unwinding has been orderly, it is persistent, erasing most of the speculative positions accumulated during the previous uptrend. With no meaningful new leverage entering the market, traders seem reluctant to express directional conviction, instead adopting a conservative, risk-averse stance as prices fall.
The derivatives complex is now in a clearly lighter leverage state, indicating a marked lack of speculative appetite and reducing the likelihood of sharp volatility driven by liquidations.

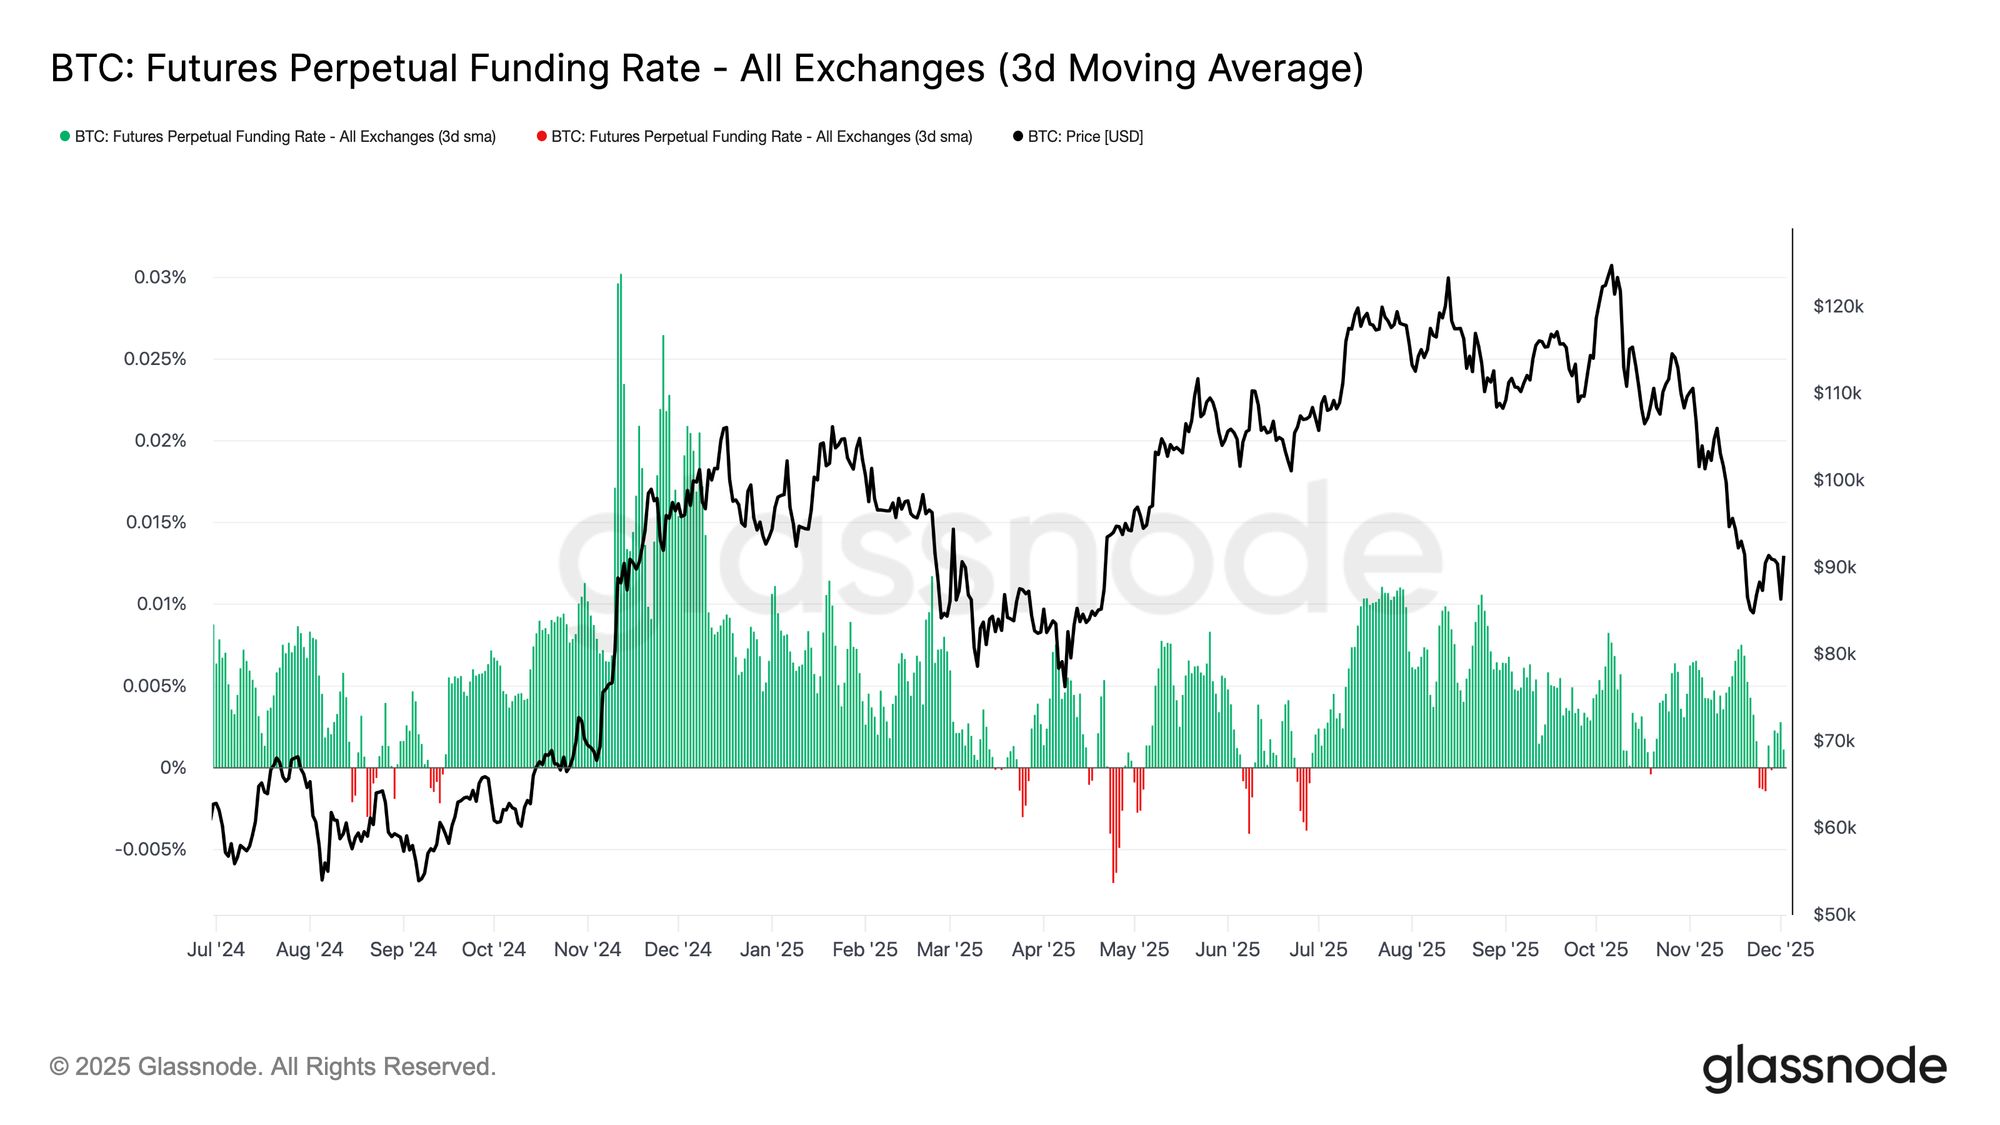
Neutral Funding Rates Signal Reset
As open interest continues to contract, perpetual funding rates have cooled to roughly neutral territory, fluctuating around zero for most of late November. This marks a clear shift from the elevated positive funding rates seen during the previous expansion, indicating that excess long positions have largely been closed out. Importantly, periods of mildly negative funding have remained brief and shallow, suggesting that traders are not aggressively building short positions despite falling prices.
This neutral to slightly negative funding structure suggests a more balanced derivatives market, lacking crowded long positions, reducing downside vulnerability, and potentially laying the groundwork for more constructive positioning when demand begins to stabilize.
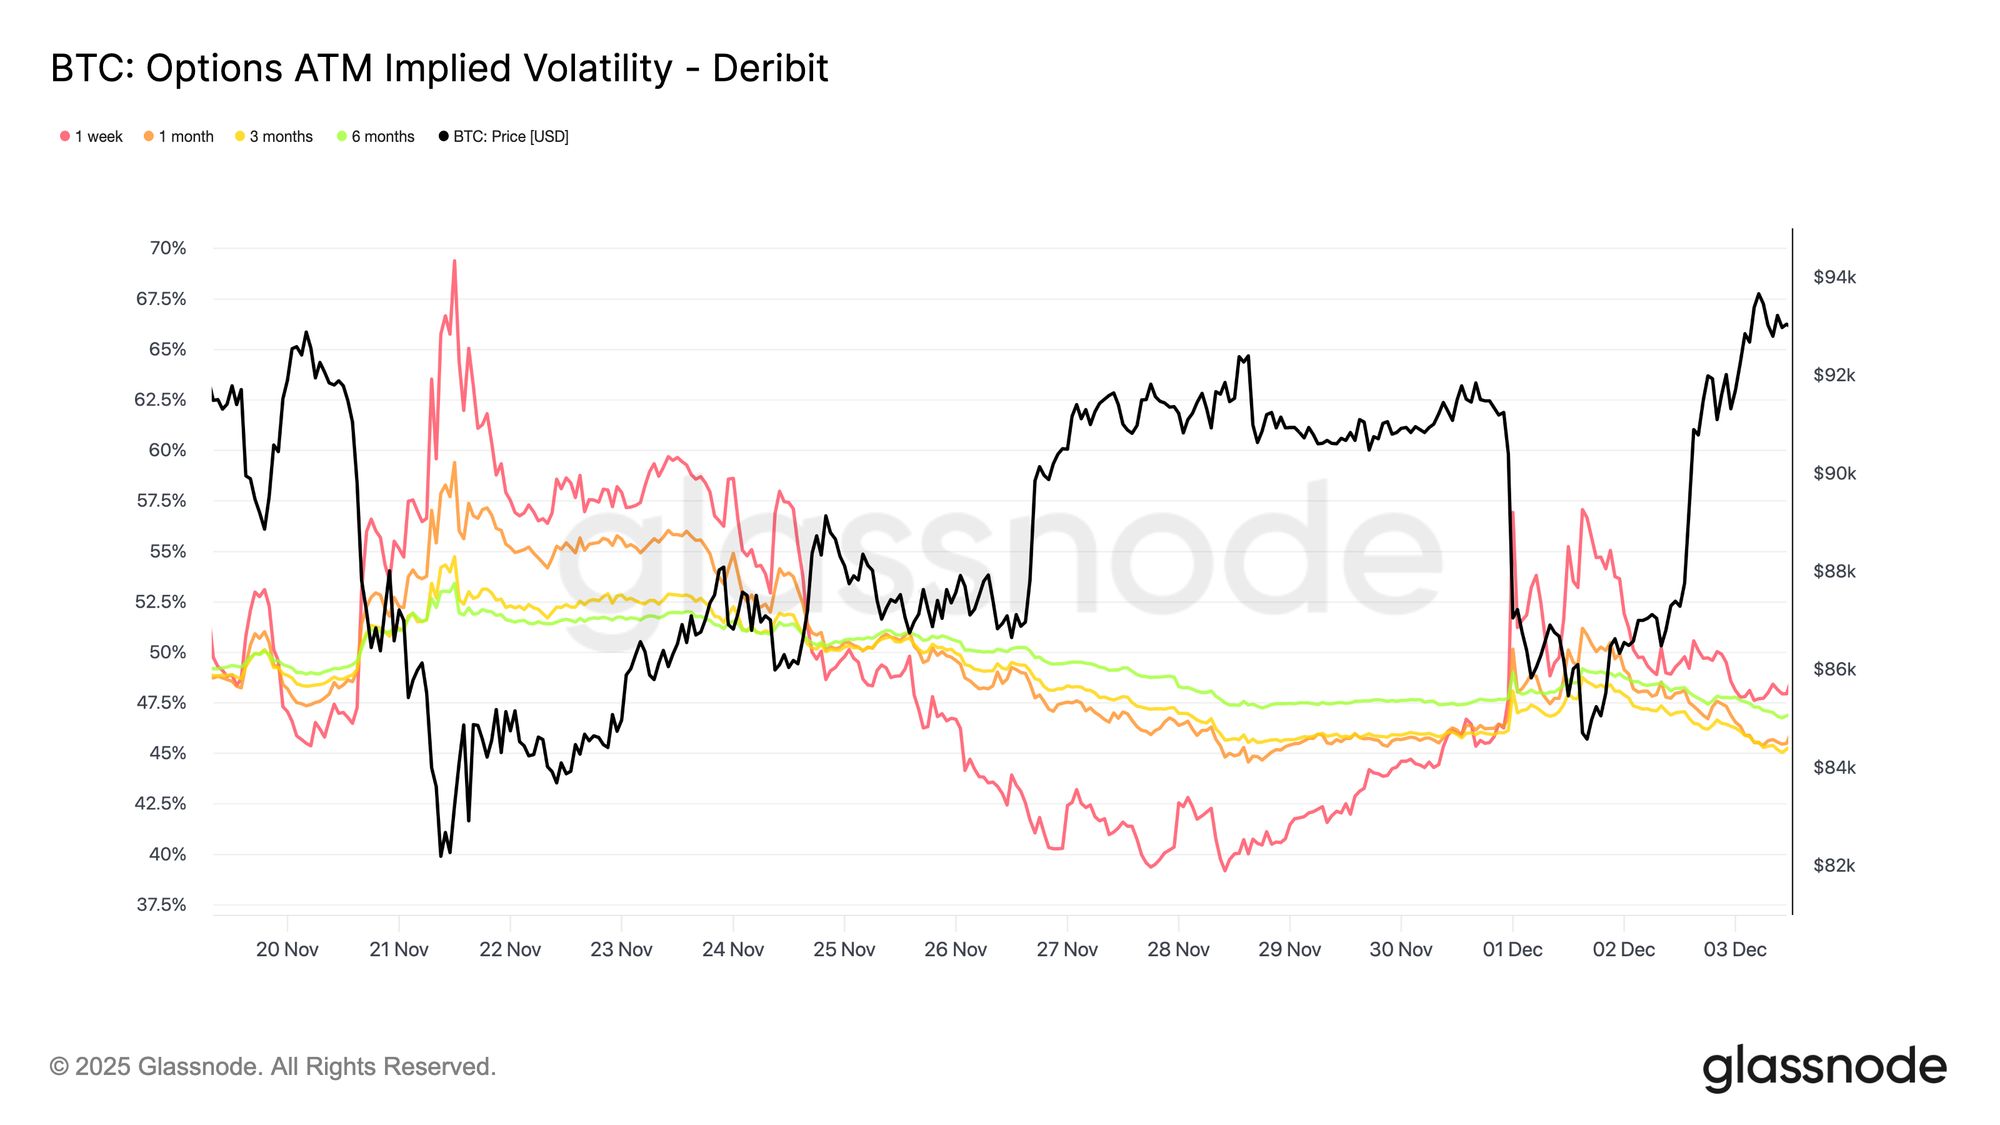
Implied Volatility (IV) Resets Across the Board
Turning to the options market, implied volatility (IV) provides a clear window into how traders are pricing future uncertainty. As a starting point, tracking implied volatility is useful because it reflects the market's expectations for future price moves. After elevated readings last week, implied volatility has reset lower. The price's inability to break through the $92K resistance and the lack of follow-through on rebounds prompted volatility sellers to re-enter, pushing implied volatility lower across the board:
- Short-term contracts fell from 57% to 48%
- Medium-term contracts fell from 52% to 45%
- Long-term contracts fell from 49% to 47%
This persistent decline suggests traders see a reduced likelihood of sharp downside and expect a calmer near-term environment.
This reset also marks a shift to a more neutral stance, as the market emerges from last week's heightened caution.
Put Skew Softens
After looking at implied volatility, skew helps clarify how traders are assessing downside versus upside risk. It measures the difference in implied volatility between puts and calls.
When skew is positive, traders pay a premium for downside protection; when skew is negative, they pay more for upside exposure. The direction and level of skew are both important.
For example, an 8% short-term skew conveys very different information if it has fallen from 18% in two days, rather than risen from negative territory.
Short-term skew moved from 18.6% on Monday (during the drop to $84.5K driven by the Japanese bond narrative) to 8.4% on the rebound.
This suggests the initial reaction was exaggerated. Longer-dated contracts adjusted more slowly, indicating traders are willing to chase short-term upside but remain uncertain about its persistence.

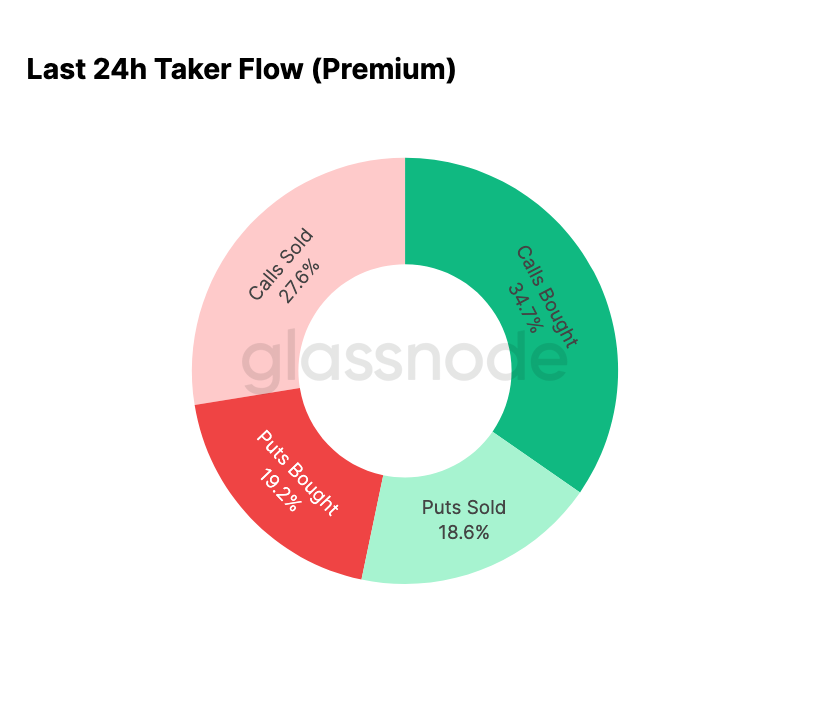
Fear Fades
Flow data shows a stark contrast between the past seven days and the subsequent rebound.
Earlier this week, activity was dominated by put buying, reflecting fears of a repeat of the August 2024 price action, which was linked to concerns about the unwinding of potential Japanese arbitrage trades. Since this risk has been experienced before, the market has a sense of how far such contagion can spread and the typical recovery that follows. Once prices stabilized, flows quickly shifted: the rebound brought a decisive tilt toward call activity, almost perfectly reversing the pattern seen during the stress period.
Notably, dealers remain net long Gamma at current levels, and this may persist through December 26 (the largest expiry of the year). Such positioning typically dampens price volatility. Once that expiry passes, positions will reset and the market will enter 2026 with a new set of dynamics.

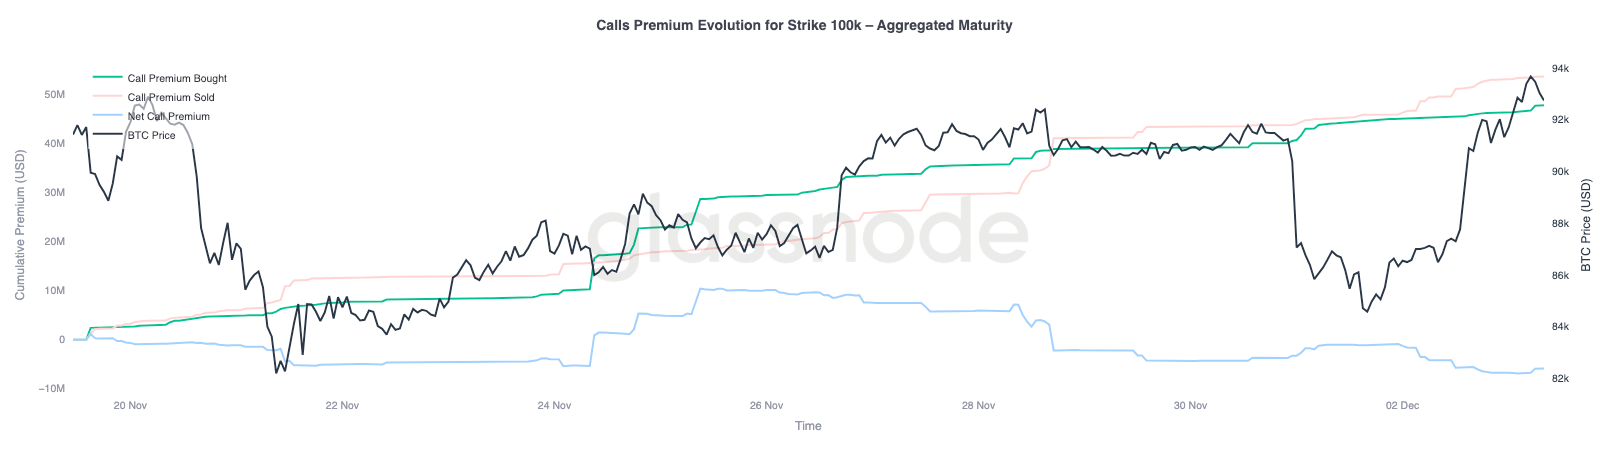
$100,000 Call Option Premium Evolution
Focusing on the call option premium at the $100,000 strike helps clarify how traders are treating this key psychological level. On the right side of the chart, call selling premiums remain higher than call buying premiums, and the gap between the two has widened during the rebound over the past 48 hours. This widening suggests that conviction in reclaiming $100,000 remains limited. This level is likely to attract resistance, especially as implied volatility compresses on the way up and rebuilds on the way down. This pattern reinforces the mean-reverting behavior of implied volatility within the current range.
The premium profile also shows that traders are not building aggressive breakout positions ahead of the FOMC meeting. Instead, flows reflect a more cautious stance, with upside being sold rather than chased. As a result, the recent recovery lacks the conviction typically required to challenge the important $100,000 level.
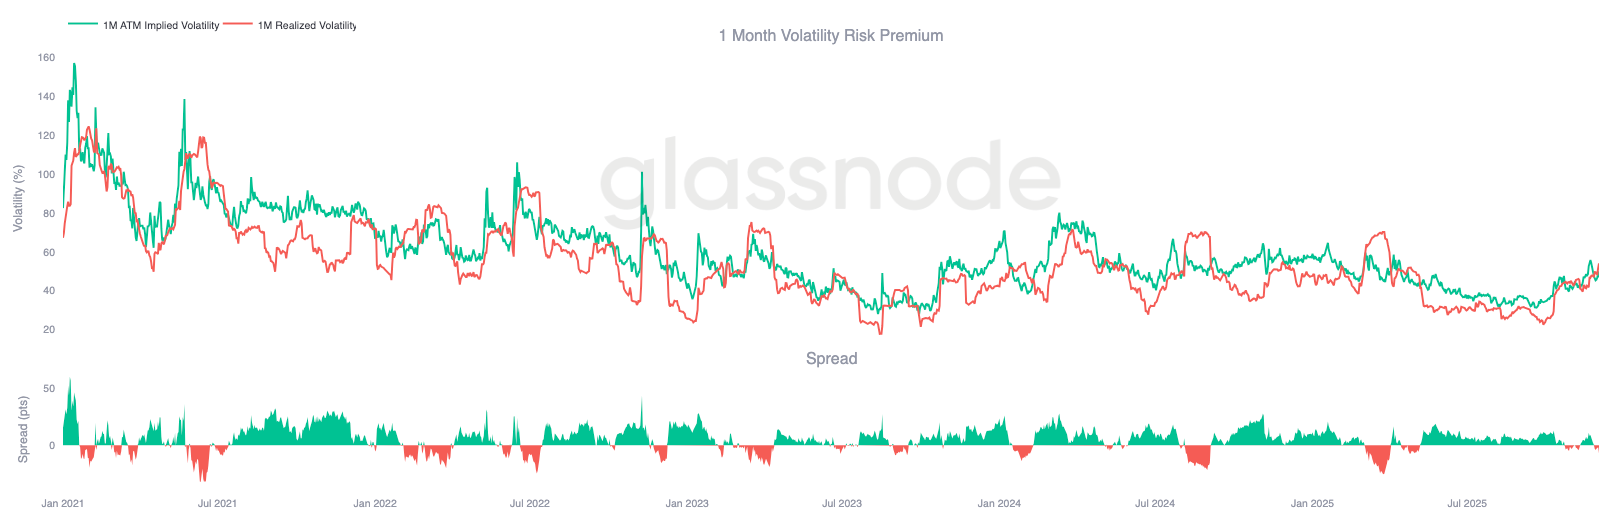
Volatility Is Undervalued
When we combine the reset in implied volatility with this week's sharp two-way swings, the result is a negative volatility risk premium. The volatility risk premium is usually positive because traders demand compensation for the risk of volatility spikes. Without this premium, short-volatility traders cannot monetize the risk they are taking on.
At current levels, implied volatility is below realized volatility, meaning options are pricing in less movement than the market is actually delivering. This creates a favorable environment for long-Gamma positions, as every price swing can generate profits as long as realized volatility exceeds what is implied by option prices.
Conclusion
Bitcoin continues to trade in a structurally fragile environment, with on-chain weakness and shrinking demand intersecting with a more cautious derivatives landscape. The price has temporarily stabilized above the "True Market Mean," but the broader structure currently closely resembles Q1 2022: over 25% of supply is underwater, realized losses are increasing, and sensitivity to macro shocks is elevated. Although much weaker than earlier this year, positive capital momentum remains one of the few constructive signals preventing a deeper market collapse.
Off-chain indicators reinforce this defensive tone. ETF flows have turned net negative, spot CVD metrics have declined, and futures open interest continues to decrease in an orderly fashion. Funding rates are near neutral, reflecting neither bullish confidence nor aggressive short pressure. In the options market, implied volatility is compressed, skew is softening, flows have reversed, and options are currently priced below realized volatility, signaling caution rather than a renewed risk appetite.
Looking ahead, holding the 0.75-0.85 quantile range ($96.1K-$106K) is crucial for stabilizing market structure and reducing downside vulnerability before year-end. Conversely, the "True Market Mean" remains the most likely bottoming area unless a negative macro catalyst disrupts the already delicate market balance.
Disclaimer: The content of this article solely reflects the author's opinion and does not represent the platform in any capacity. This article is not intended to serve as a reference for making investment decisions.
You may also like
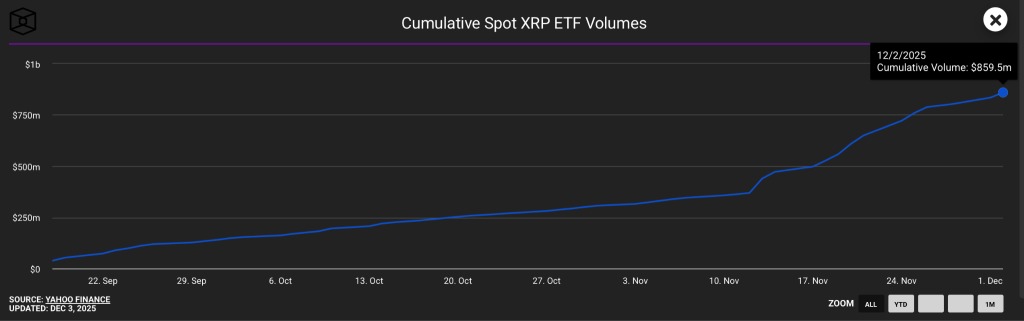
XRP ETF Flows Hit Record High—What It Means for XRP Price
Ethereum Hits New All-Time High for TPS Ahead of Fusaka Upgrade
Pi Network News: Expert Says ‘Sleeping Giant’ Fails to Wake As Stalled Protocol 23 Raises Doubts