Bitcoin Faces a Reality Check as Small Business Optimism Crashes

Bitcoin price is trading around 103,000 after another day of choppy price action. The broader market tone is cautious as risk assets respond to softening economic signals from the U.S. Small business optimism dropped to its lowest level since April, according to the National Federation of Independent Business (NFIB), with hiring and sales both weakening. This comes amid prolonged government shutdown worries that have stalled economic momentum. The question now is whether Bitcoin can stay resilient—or whether fading U.S. growth expectations will weigh on crypto markets too.
Economic Backdrop: A Warning Signal for Bitcoin Price
The NFIB survey paints a picture of slowing U.S. business activity, declining profits, and hiring shortages. Historically, when business confidence weakens, liquidity-sensitive assets like equities—and by extension, Bitcoin price tend to struggle. A slowdown in small business activity usually leads to weaker payrolls, reduced capital investment, and softer consumer spending.
Markets are watching the U.S. Congress closely for a resolution to the government shutdown. If the shutdown persists, data collection delays and disrupted government services could further pressure investor confidence. Bitcoin, which thrives on liquidity and speculation, could see reduced buying interest if risk sentiment deteriorates.
However, the silver lining is that weaker business data may revive expectations of Federal Reserve rate cuts earlier than anticipated. Lower interest rates often translate to higher liquidity and renewed appetite for non-yielding assets like Bitcoin. This macro uncertainty sets the stage for volatile range trading in the weeks ahead.
Technical Analysis: Bitcoin Price Struggles Below Resistance
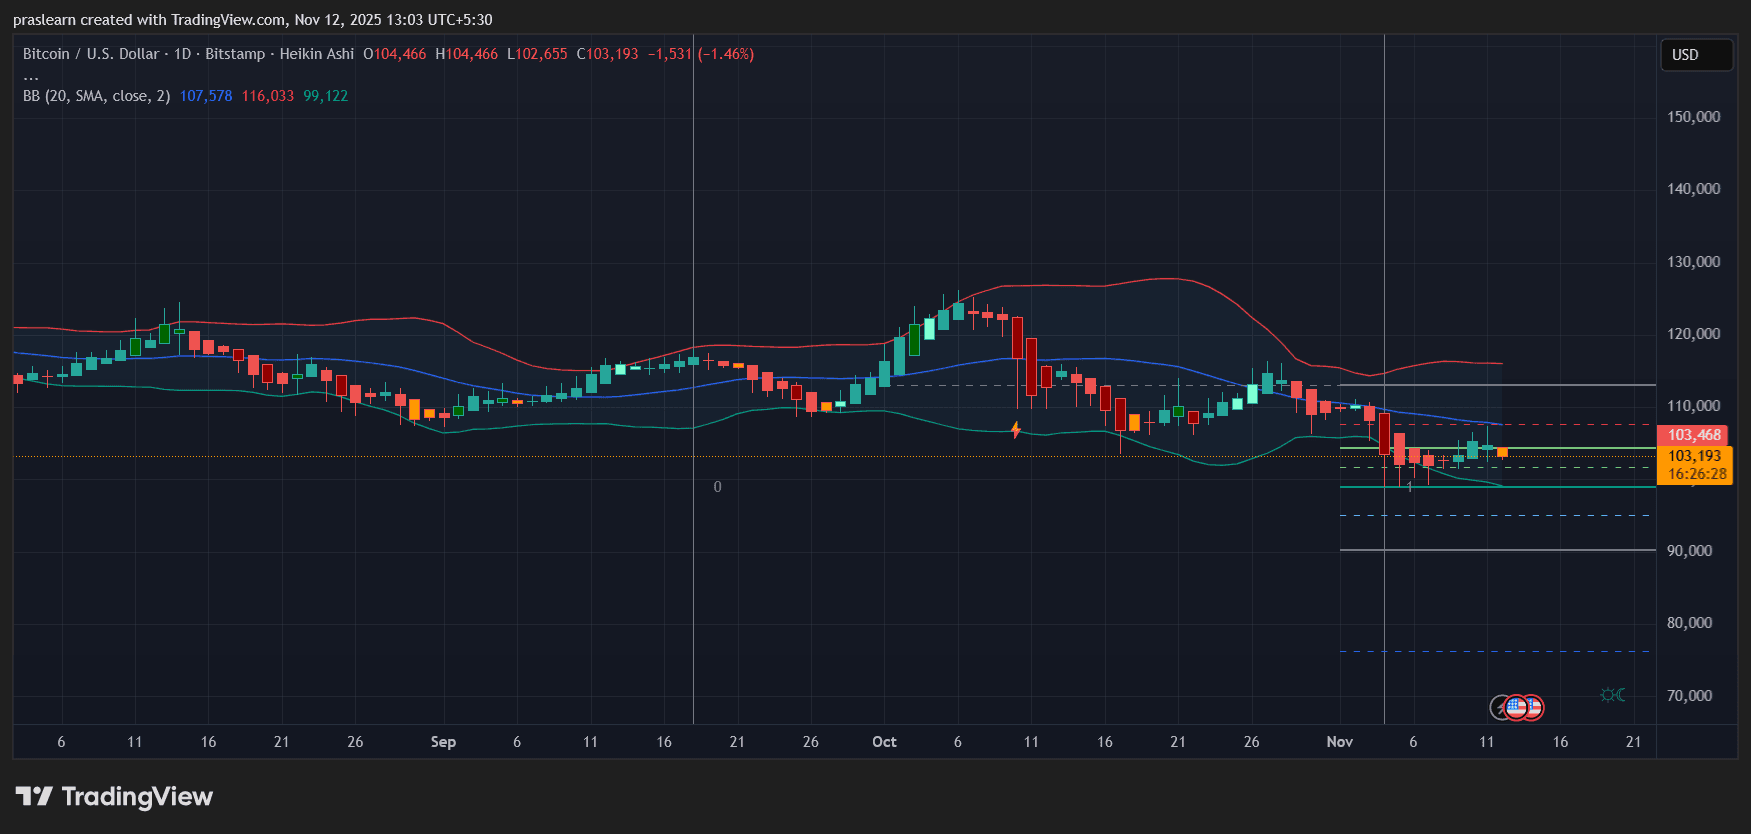 BTC/USD Daily Chart- TradingView
The daily chart shows Bitcoin price consolidating within a narrow range, with price sitting just below the midline of the Bollinger Bands (20-SMA near 107,500). The upper band at 116,000 serves as immediate resistance, while the lower band around 99,000 provides critical short-term support.
The Heikin Ashi candles reflect a gradual loss of bullish momentum since late October’s rally. Consecutive red candles with small bodies indicate indecision rather than a deep correction. Volume has thinned out, suggesting traders are waiting for a macro trigger—perhaps the government funding vote—to determine direction.
So far, 103,000 is acting as a weak pivot zone. A break below 102,000 could open the door to the 99,000–97,000 support cluster, while a daily close above 107,500 might trigger a short-term bullish breakout toward 110,000.
Momentum Indicators: Neutral-to-Bearish Bias
The Bollinger Band squeeze pattern also signals potential volatility ahead. Historically, when BTC price volatility compresses to this degree, a strong directional move tends to follow—often within 5–10 trading days. Given the current structure, that move could go either way depending on macro cues.
Bitcoin Price Prediction: Key Levels to Watch
- Resistance: 107,500 (20-day SMA), followed by 110,000 and 116,000
- Support: 102,000 (short-term), 99,000 (lower Bollinger Band), and 97,000 (October swing low)
- Invalidation: A daily close below 97,000 would confirm a deeper correction toward 90,000
If Bitcoin price closes above 107,500 with rising volume, a rebound toward 110,000 becomes probable. However, failure to hold 102,000 would suggest a continuation of the descending channel that began in mid-October.
Macro and On-Chain Crosscurrents
Despite the soft U.S. data, Bitcoin’s on-chain health remains stable. Exchange reserves continue to trend lower, suggesting that long-term holders are not panic-selling. Meanwhile, stablecoin inflows have plateaued, implying that traders are waiting on macro clarity before re-entering the market.
The next few days will be critical as the U.S. House of Representatives votes on the spending bill. If the shutdown officially ends, we could see a short-term relief rally across equities and Bitcoin alike. But if political deadlock persists, a dip below 100,000 wouldn’t surprise.
30-Day Bitcoin Price Prediction: Choppy, Then Directional
In the near term, BTC price is likely to oscillate between 99,000 and 110,000 until a macro catalyst breaks the range. A confirmed end to the government shutdown could lift sentiment and push BTC toward 115,000–118,000. Conversely, continued fiscal gridlock or disappointing economic data could send prices to retest 95,000 or even 90,000 by early December.
Bitcoin’s current setup reflects a market in wait-and-see mode. The technical picture favors consolidation, while macro signals—like weakening small business confidence—tilt sentiment cautiously bearish. Yet, the underlying resilience of $BTC holder base and cooling inflation may provide a safety net.
For now, traders should watch 102,000 and 107,500 closely. A break of either side will likely define Bitcoin’s direction heading into year-end. Until then, volatility compression suggests patience might pay off more than prediction.
Disclaimer: The content of this article solely reflects the author's opinion and does not represent the platform in any capacity. This article is not intended to serve as a reference for making investment decisions.
You may also like
QTUM Rises 3.89% as Brief Volatility Subsides
- QTUM rose 3.89% in 24 hours on Nov 12, 2025, closing at $1.913, but fell 36.11% year-to-date. - Short-term rebound suggests easing selling pressure, with RSI in oversold territory and narrowing MACD hinting at limited near-term declines. - Key resistance at $1.913 has repeatedly tested QTUM, with breakout potential to drive buying or reinforce range-bound patterns. - Backtesting efforts stalled due to data feed errors, requiring confirmation of the correct ticker symbol for QTUM.
HOT rises by 2.42% on November 12, 2025 following Pelephone’s updated offer for Hot Mobile
- HOT token rose 2.42% on Nov 12, 2025, amid Pelephone’s revised $565M bid for Hot Mobile, though it fell 72.66% annually. - Pelephone, a Bezeq subsidiary, raised its offer to NIS 2.1B (time-limited until Nov 16), competing with a $378M bid from Gil Sharon’s consortium. - Hot Mobile’s Q3 revenue reached NIS 517M with 2.66M subscribers, as Altice seeks to reduce debt through the sale. - Technical indicators show mixed trends, with short-term stabilization but long-term bearish pressure, as investors monitor
Bitwise’s Chainlink ETF Listed on DTCC as Institutional Interest in LINK Rises

Visa Launches Program to Speed Cross-Border Payments via Stablecoins