Bitget App
Trade smarter
Buy cryptoMarketsTradeFuturesEarnSquareMore
Polkadot (DOT) Poised for a Rally Following 400% Surge in ICP’s Price

Polkadot (DOT) Poised for a Rally Following 400% Surge in ICP’s Price

CoineditionCoinedition2024/01/07 14:57
By:Collins Adane
  • DOT and ICP’s values have rallied significantly in the last month.
  • However, ICP’s value gains have outpaced DOT.
  • DOT appears poised to initiate an uptrend to catch up with ICP.

Polkadot (DOT) has been closely trailing Internet Computer (ICP) in recent price gains, sparking discussion among crypto analysts about whether DOT is due for a significant upward swing.

In a recent post on X (formerly Twitter), crypto analyst Tony Bitcoin opined that DOT might be poised for a potential catch-up rally following the 400% surge in ICP’s value since November 2023.

#Polkadot #DOT and #ICP I have been observing for some time that they are on a par, $ICP has gone up from its minimum 400% and $DOT 150% so now it has to be equalized with $ICP and so now $DOT has to go up 250% pic.twitter.com/VcxVD2gLh0

— Tony ₿itcoin⚡ (@Toni_Bitcoin) January 4, 2024

Rally Looks Likely

An assessment of DOT’s price movement on a weekly chart showed that the predicted rally might occur. 

Polkadot (DOT) Poised for a Rally Following 400% Surge in ICP’s Price image 0 DOT/USDT 7-Day Chart (Source: TradingView )

An indicator that suggested this was the coin’s ADA’s Parabolic SAR (Stop and Reverse). At press time, the dotted lines that make up the indicator were positioned below DOT’s price .

When this indicator moves in this manner, it signifies a bullish trend. An increasing gap between an asset’s price and its SAR suggests that the asset may have room to climb further before the SAR catches up and signals a potential reversal.

Further, despite the 16% price retracement last week, DOT traders have continued accumulating the altcoin. Key momentum indicators were spotted in uptrends at the time of writing.

For example, the coin’s Money Flow Index (MFI) was 85.86, while its Relative Strength Index (RSI) was 58.23. 

Likewise, the altcoin’s Chaikin Money Flow (CMF) rested above the zero line at 0.17. At this value, the CMF showed that the DOT market witnessed an adequate inflow of liquidity.

Confirming the bullish trend, readings from ADA’s Moving average convergence divergence (MACD) indicator showed the MACD line (blue) above the trend line. When these lines trend in this manner, it means that buying momentum exceeds coin sell-offs. 

However, due to the recent price dip, DOT’s derivatives market participants have gradually exited their trading positions. According to data from Coinglass , the price decline in the last week has been accompanied by a drop in DOT’s futures open interest. 

At $226.81 million at press time, it has declined by 29% since 26 December.

Disclaimer: The information presented in this article is for informational and educational purposes only. The article does not constitute financial advice or advice of any kind. Coin Edition is not responsible for any losses incurred as a result of the utilization of content, products, or services mentioned. Readers are advised to exercise caution before taking any action related to the company.

0

Disclaimer: The content of this article solely reflects the author's opinion and does not represent the platform in any capacity. This article is not intended to serve as a reference for making investment decisions.

PoolX: Earn new token airdrops
Lock your assets and earn 10%+ APR
Lock now!

You may also like

As economic cracks deepen, bitcoin may become the next liquidity "release valve"

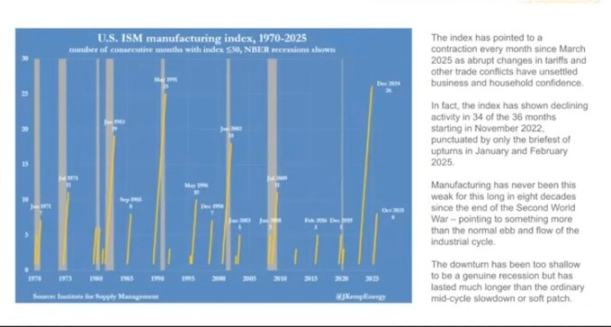
The US economy is showing a divided state, with financial markets booming while the real economy is declining. The manufacturing PMI continues to contract, yet the stock market is rising due to concentrated profits in technology and financial companies, resulting in balance sheet inflation. Monetary policy struggles to benefit the real economy, and fiscal policy faces difficulties. The market structure leads to low capital efficiency, widening the gap between rich and poor and increasing social discontent. Cryptocurrency is seen as a relief valve, offering open financial opportunities. The economic cycle oscillates between policy adjustments and market reactions, lacking substantial recovery. Summary generated by Mars AI. The accuracy and completeness of this summary are still being iteratively updated by the Mars AI model.

MarsBit2025/11/14 12:23
As economic cracks deepen, bitcoin may become the next liquidity "release valve"

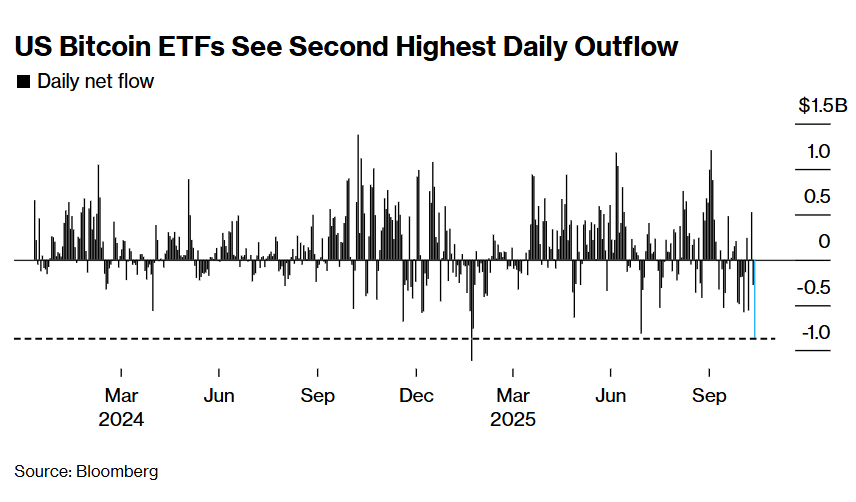
The wave of cryptocurrency liquidations continues! US Bitcoin ETF sees second highest single-day outflow in history

Due to the reassessment of Federal Reserve rate cut expectations and the fading rebound of the U.S. stock market, the crypto market continues to experience liquidations, with significant ETF capital outflows and options traders increasing bets on volatility. Institutions warn that technical support for bitcoin above $90,000 is weak.

Jin102025/11/14 12:16
The wave of cryptocurrency liquidations continues! US Bitcoin ETF sees second highest single-day outflow in history

When traditional financial markets fail, will the crypto industry become a "pressure relief valve" for liquidity?

As long as the system continues to recycle debt into asset bubbles, we will not see a true recovery—only a slow stagnation masked by rising nominal figures.

深潮2025/11/14 11:14
When traditional financial markets fail, will the crypto industry become a "pressure relief valve" for liquidity?