
Ethereum Pushes for $2.5K as The Bulls Come Back in Town (ETH Price Analysis)

Ethereum’s recent price action has seen it find support around the critical 100-day moving average, signaling a shift in market sentiment from bearish to bullish. ETH has embarked on a bullish retracement and has now reached a pivotal resistance region, setting the stage for its next move.
Technical Analysis
By Shayan
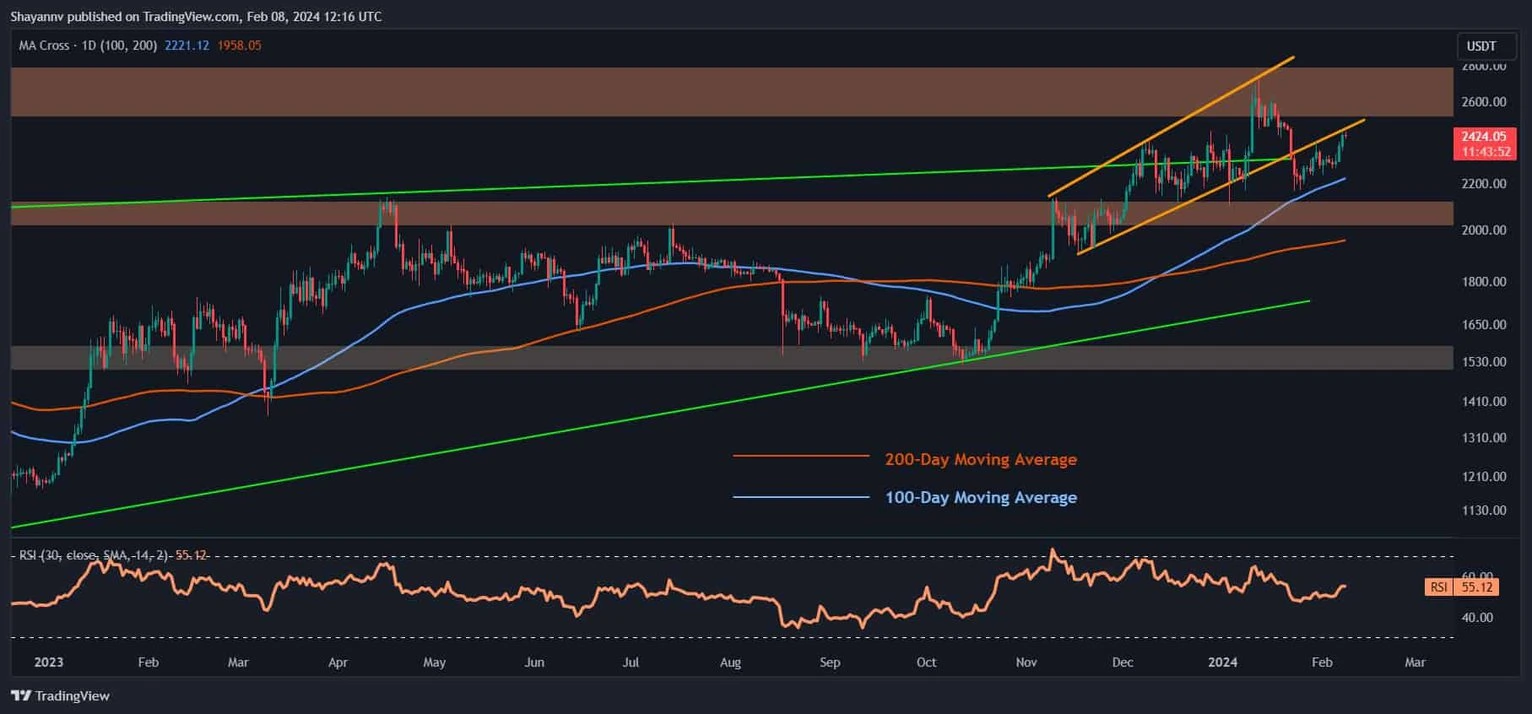
The Daily Chart
A comprehensive examination of Ethereum’s daily chart unveils a shift in market sentiment, with the significant 100-day moving average at $2225 providing robust support. Concurrently, Ethereum experienced a rebound, propelling the price toward a critical resistance region, which encompasses the lower boundary of the expanding wedge pattern and the static $2.6K price zone.
Should ETH surpass this critical resistance, it could herald a new phase of bullish movements, leading to heightened volatility in the market. Thus, Ethereum’s price action near this crucial range holds paramount importance in determining the cryptocurrency’s forthcoming trend.
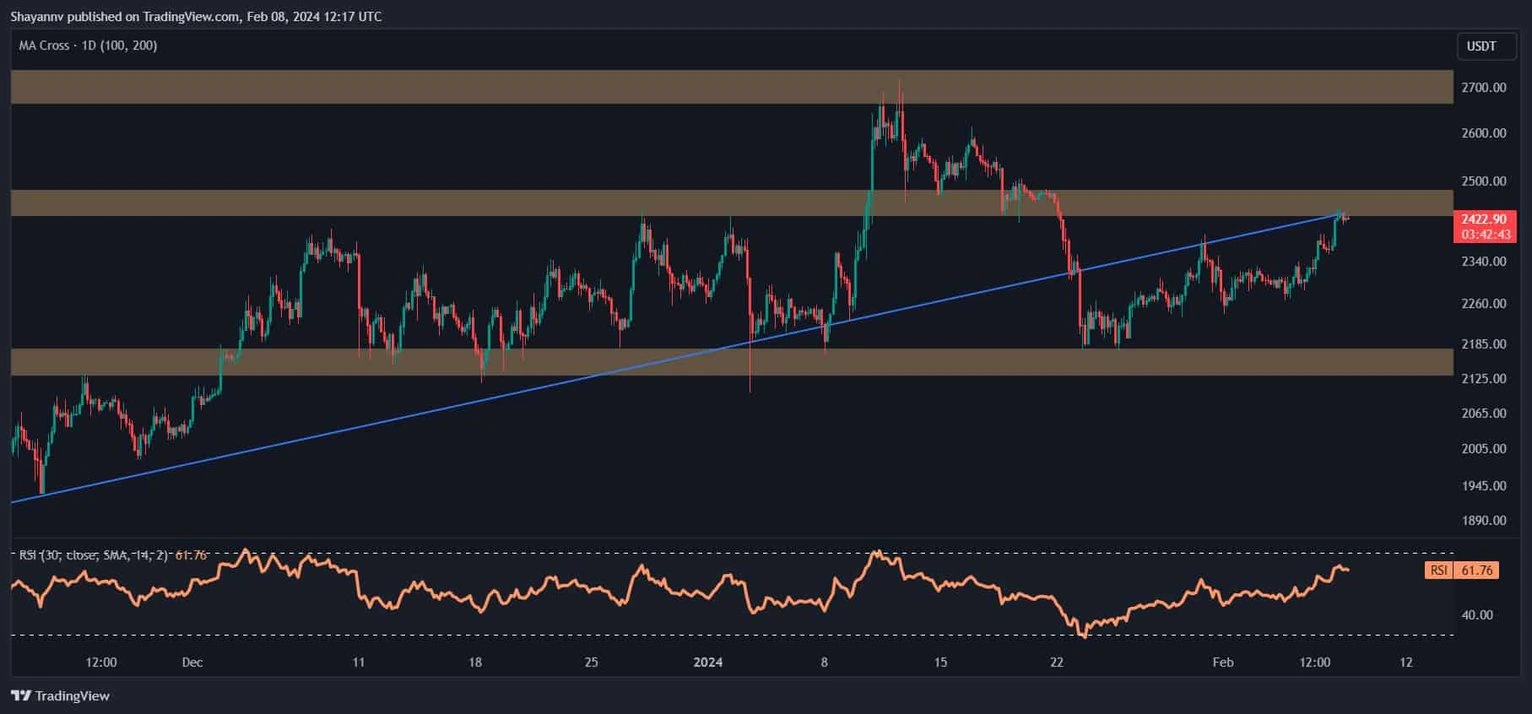
The 4-Hour Chart
An analysis of the 4-hour chart reveals that following an impulsive cascade, Ethereum faced substantial buying pressure, triggering a reversal. This surge in buying activity propelled the price upward, leading to a retracement towards the ascending trendline in an attempt to reclaim it.
Currently, the price has encountered a significant resistance region, marked by the static zone at $2450 and the ascending trendline.
This crucial resistance has thwarted recent attempts by the buyers to breach it, establishing itself as a formidable barrier.
Nonetheless, the forthcoming price action around this critical resistance will likely determine Ethereum’s next direction, with expectations of heightened market activity in the short term. Continued monitoring of these key levels will be essential for assessing ETH’s potential trajectory.
On-chain Analysis
By Shayan
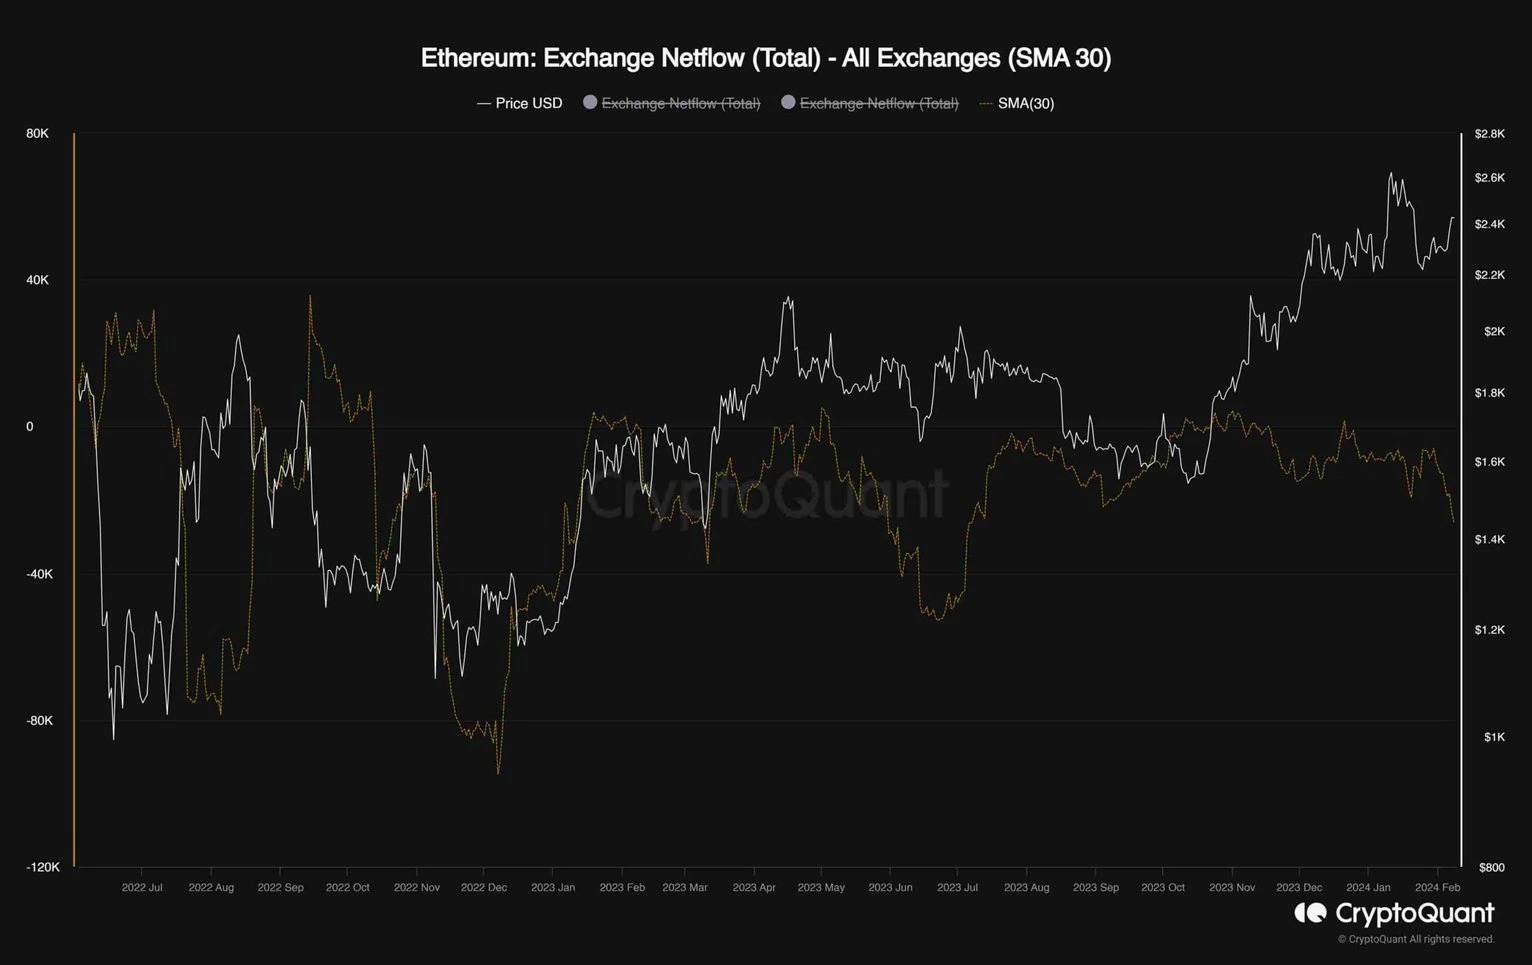
The chart depicted illustrates Ethereum’s exchange netflow metric alongside its price, representing the disparity between coins entering and exiting exchanges. Notably, positive values signify an increase in exchange reserves, indicating potential heightened selling pressure, whereas negative values indicate a decrease in reserves, suggesting ongoing accumulation.
An insightful observation from the chart is that each sustained uptrend coincided with the metric trending downwards in the negative region.
Presently, after a period of consolidation, the metric is exhibiting a decline, signaling potential accumulation in the market. Should this behavior persist, Ethereum can anticipate another upward rally in the mid-term.
Disclaimer: The content of this article solely reflects the author's opinion and does not represent the platform in any capacity. This article is not intended to serve as a reference for making investment decisions.
You may also like
Surviving Three Bull and Bear Cycles, Dramatic Revival, and Continuous Profits: The Real Reason Curve Became the “Liquidity Hub” of DeFi
Curve Finance has evolved from a stablecoin trading platform into a cornerstone of DeFi liquidity through its StableSwap AMM model, veTokenomics, and strong community resilience, demonstrating a sustainable development path. Summary generated by Mars AI. The accuracy and completeness of this summary, generated by the Mars AI model, are still in the process of iterative improvement.

![[Bitpush Daily News Selection] Financial Times: Tether is considering leading a funding round of approximately $1.16 billion for German tech startup Neura Robotics; the US SEC has issued post-shutdown document processing guidance, and multiple crypto ETFs may be expedited; US Bureau of Labor Statistics: September 2025 employment data will be released on November 20, and October state employment and unemployment data will be released on November 21.](https://img.bgstatic.com/multiLang/image/social/06829a455cc5ced5cafaf4b9bf53d5281763243641786.png)
SOL drops to 5-month low despite Solana spot ETF success: Is $100 next?

Major Overhaul in US Crypto Regulation: CFTC May Fully Take Over the Spot Market
The US crypto regulatory framework is undergoing a redistribution of authority, with clear divisions of responsibility between the CFTC and SEC: the SEC focuses on securities, while the CFTC is responsible for the spot market of digital commodities. The advancement of new bills and the arrangement of hearings indicate that the regulatory boundaries have been formally clarified in official documents for the first time. Summary generated by Mars AI. This summary is generated by the Mars AI model, and the accuracy and completeness of its content are still being iteratively updated.

Trending news
MoreSurviving Three Bull and Bear Cycles, Dramatic Revival, and Continuous Profits: The Real Reason Curve Became the “Liquidity Hub” of DeFi
[Bitpush Daily News Selection] Financial Times: Tether is considering leading a funding round of approximately $1.16 billion for German tech startup Neura Robotics; the US SEC has issued post-shutdown document processing guidance, and multiple crypto ETFs may be expedited; US Bureau of Labor Statistics: September 2025 employment data will be released on November 20, and October state employment and unemployment data will be released on November 21.