Crypto Derivatives: Analytics Report – Week 8

Key Insights:
Since the previous update, both BTC and ETH annualised yields have continued to rise, reaching their highest levels since the buildup of leverage preceding BTC’s ETF announcement. Continued positive funding rates for BTC and ETH perpetual swaps indicate demand for leveraged long exposure. BTC’s SABR ATM implied volatility has risen significantly across all tenors, with a strong skew towards OTM calls in BTC’s 25-Delta Risk Reversal, especially at longer-dated tenors. ETH’s volatility has also increased notably, particularly at the 3-month tenor, but with a less bullish sentiment at shorter-dated tenors, indicated by a tilt towards puts in the 25-Delta Risk Reversal. Both BTC and ETH implied vol surfaces have trended upward over the past 30 days, suggesting ongoing market volatility across derivatives markets.
Futures Implied Yield, 1-Month Tenor

ATM Implied Volatility, 1-Month Tenor

*All data in tables recorded at a 10:00 UTC snapshot unless otherwise stated.
Futures

BTC ANNUALISED YIELDS – have consistently risen over the past 10 days to their highest levels since the buildup of leverage ahead of BTC’s ETF.

ETH ANNUALISED YIELDS – show a similar premium assigned to futures over ETH’s spot price that has a far steeper term structure than BTC’s.

Perpetual Swap Funding Rate
BTC FUNDING RATE – funding rates have remained consistently positive over the past month, indicating demand for leveraged long exposure.

ETH FUNDING RATE – perpetual swaps continue to trade at slight premiums to spot prices, as reflected in the consistently high funding rate.

BTC Options

BTC SABR ATM IMPLIED VOLATILITY – volatility has continued its consistent rise, now 20 points higher than at the beginning of the month.

BTC 25-Delta Risk Reversal – the skew towards OTM calls has shown no signs of reversing yet, reporting a strong tilt at longer-dated tenors.

ETH Options

ETH SABR ATM IMPLIED VOLATILITY – ETH’s volatility reports a similarly high and consistent rise in February, rising slightly higher at a 3M tenor.

ETH 25-Delta Risk Reversal – ETH’s vol skews are far less bullish than BTC’s at shorter-dated tenors, which report a significant tilt towards puts.

Volatility Surface
BTC IMPLIED VOL SURFACE – volatility across the surface has risen in tandem with the strong upward trend in the ATM vol level.

ETH IMPLIED VOL SURFACE – like BTC reports a consistent and strong trend upward over the past 30 days, focused slightly on 3M and 6M tenors.

Z-Score calculated with respect to the distribution of implied volatility of an option at a given delta and tenor over the previous 30-days of hourly data, timestamp 10:00 UTC, SABR smile calibration.
Volatility Smiles
BTC SMILE CALIBRATIONS – 29-Mar-2024 Expiry, 10:00 UTC Snapshot.

ETH SMILE CALIBRATIONS – 29-Mar-2024 Expiry, 10:00 UTC Snapshot.

Historical SABR Volatility Smiles
BTC SABR CALIBRATION – 30 Day Tenor, 10:00 UTC Snapshot.

ETH SABR CALIBRATION – 30 Day Tenor, 10:00 UTC Snapshot.

Disclaimer: The content of this article solely reflects the author's opinion and does not represent the platform in any capacity. This article is not intended to serve as a reference for making investment decisions.
You may also like
The Story of Brother Machi's "Going to Zero": Just Be Happy
New Bitcoin highs could take 2 to 6 months but data says it’s worth the wait: Analysis

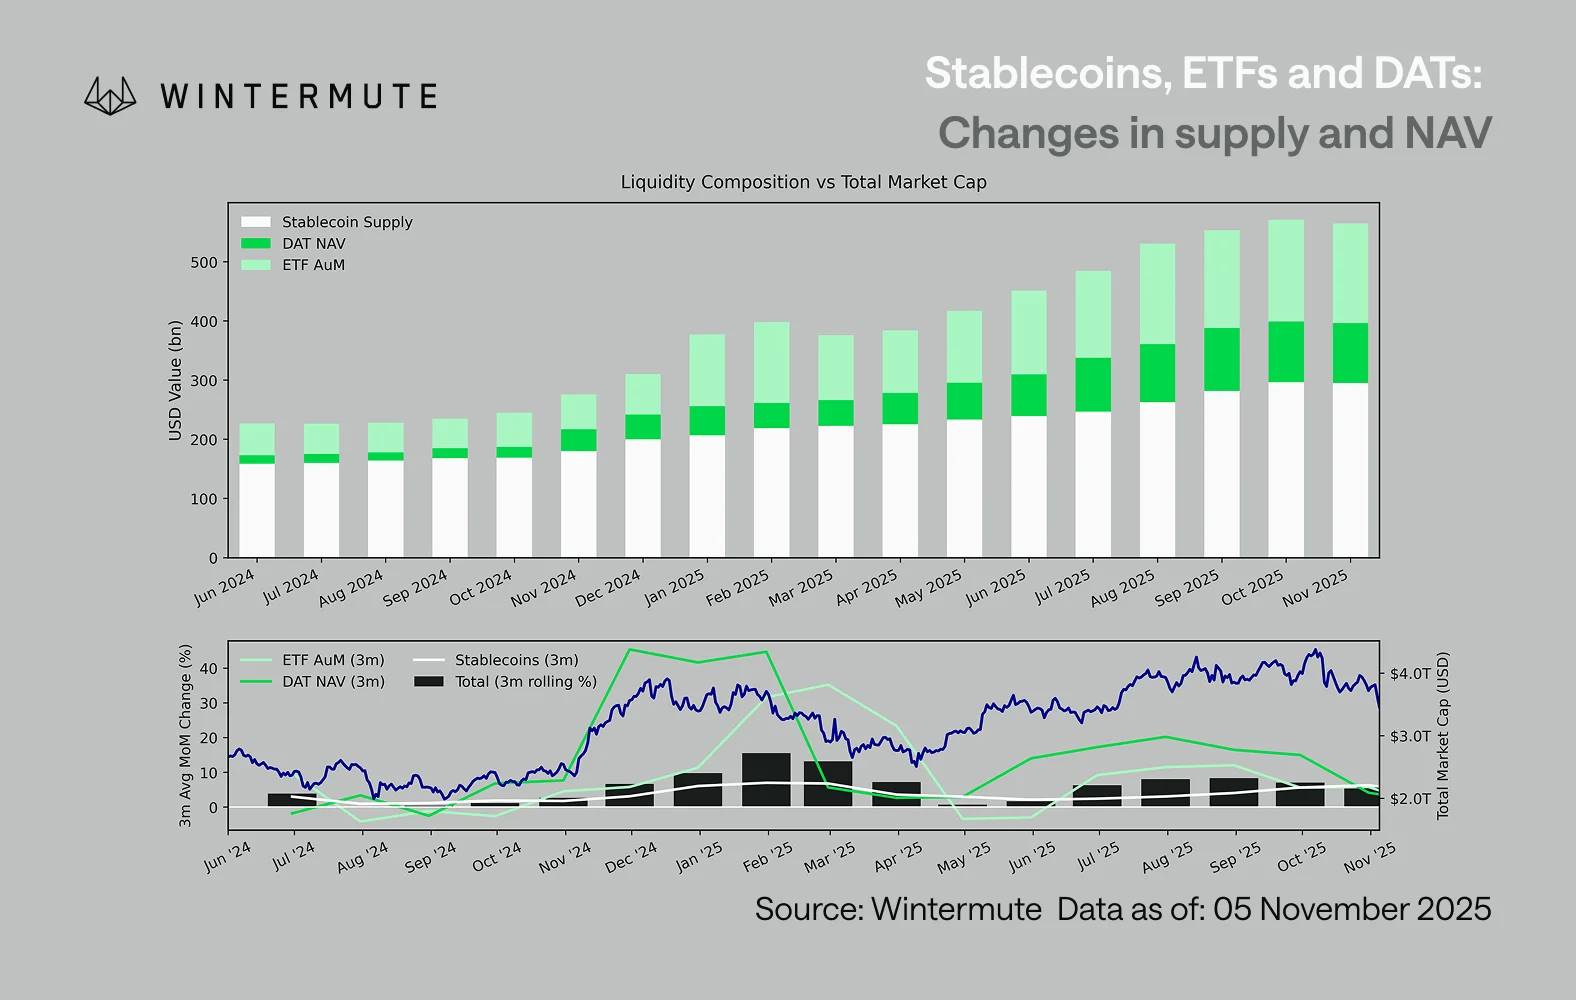
Wintermute: Liquidity, the Lifeline of the Crypto Industry, Is in Crisis
Liquidity determines every cryptocurrency cycle.
Ray Dalio's latest post: This time is different, the Federal Reserve is fueling a bubble
Because the fiscal side of government policy is now highly stimulative, quantitative easing will effectively monetize government debt, rather than simply reinjecting liquidity into the private system.