
XRP Price Prediction For February 9

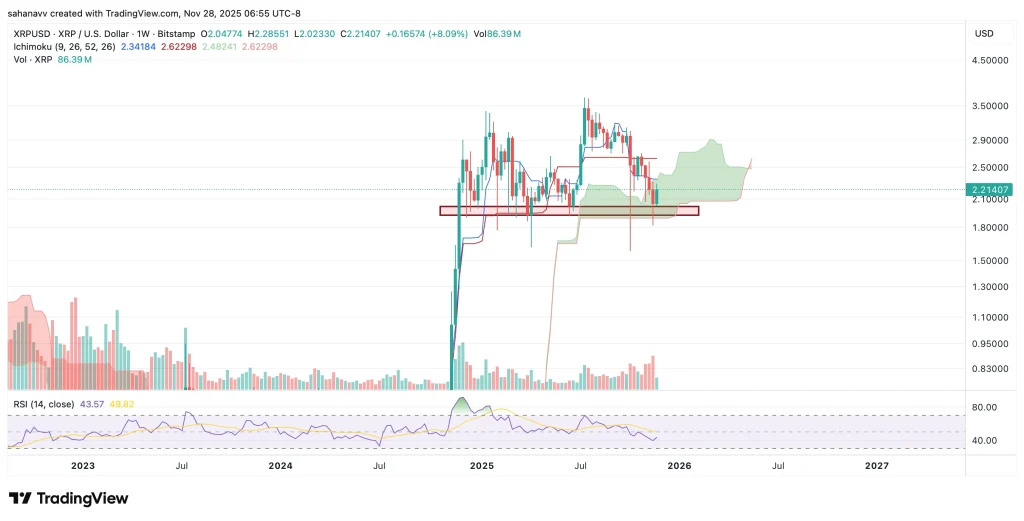
Ripple’s XRP is currently trading below the $2.50 mark and has drifted into the red zone. The price of XRP is currently experiencing a short-term bounce from an area of support, which lies between $2.25 and $2.30. According to analyst Josh of Crypto World, XRP were to break below this support level, with a daily candle closing under $2.25, the next key support level to watch would be around $1.95 to $2. For now, the price is holding up in this support zone.
Resistance Levels to Watch
As XRP continues its bounce, it faces resistance between $2.58 and $2.73. This zone will be crucial to monitor. If XRP breaks through this resistance and closes above $2.73 on the daily chart, we could see the next resistance levels around $2.95, followed by $3.20 and $3.30 to $3.40. These levels will be major hurdles for the price to overcome.
Bearish Divergence: Still Active but Paused
A larger bearish divergence is still in play, meaning there could be downward pressure on the price in the longer term. However, there hasn’t been any clear signal yet to invalidate this bearish divergence. In the short term, though, the bearish divergence seems to be “on pause.” This pause could last for the next few days as the market is seeing a slight relief from downward pressure.
Bullish Divergence on the 8-Hour Chart
On the 8-hour chart, there’s a bullish divergence forming. This means that while the price is making lower lows, the Relative Strength Index (RSI) is showing higher lows. This is often seen as a signal for a potential upward move or at least some sideways action. Historically, bullish divergences like this tend to play out over the course of several days, which could lead to a slight bullish relief in the short term.
Disclaimer: The content of this article solely reflects the author's opinion and does not represent the platform in any capacity. This article is not intended to serve as a reference for making investment decisions.
You may also like
No wonder Buffett finally bet on Google
Google holds the entire chain in its own hands. It does not rely on Nvidia and possesses efficient, low-cost computational sovereignty.
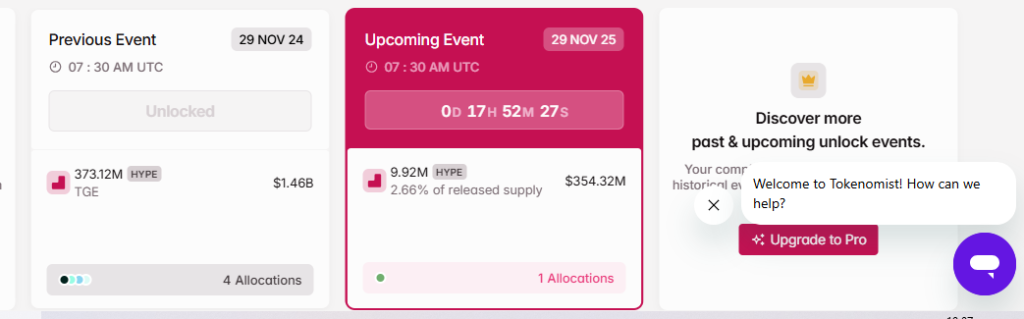
HYPE Price Prediction December 2025: Can Hyperliquid Absorb Its Largest Supply Shock?
XRP Price Stuck Below Key Resistance, While Hidden Bullish Structure Hints at a Move To $3
Bitcoin Price Prediction: Recovery Targets $92K–$101K as Market Stabilizes