Pi Network (PI) Breaks All-Time Highs as Volume Exceeds $3 Billion
Pi Network has exploded 60% in the last 24 hours, pushing its market cap to $16 billion while technical indicators present a mixed outlook for future price action.
Pi Network (PI) has skyrocketed more than 70% in the last 24 hours, propelling its market capitalization to $16 billion and its volume to more than $2.3 billion in the last 24 hours.
Despite reaching new all-time highs near $3, this technical divergence suggests a volatile path ahead for PI. Traders are watching closely as the token navigates between bullish momentum that could drive it toward $4 and warning signs that might trigger a pullback to support levels as low as $1.7 or even $0.79.
Pi Network DMI Shows the Uptrend Is Very Strong
The Pi Network’s Directional Movement Index (DMI) is showing remarkable momentum, with its Average Directional Index (ADX) surging to 57.7 from just 12.3 a day ago.
The ADX is a key technical indicator that measures the strength of a trend regardless of its direction. Readings below 20 generally indicate a weak trend, 20-40 suggest a moderate trend, and values above 40 signal a strong trend.
This dramatic increase in Pi’s ADX from weak to very strong territory indicates a significant intensification in the underlying trend’s strength.
 PI DMI. Source:
TradingView.
Complementing this ADX surge, Pi’s Positive Directional Indicator (+DI) climbed sharply to 40.9 from 14.6 two days ago, while its Negative Directional Indicator (-DI) plummeted to 1.1 from 19.4 in the same period.
When +DI is significantly higher than -DI, as is currently the case with Pi, it confirms a strong bullish trend. The combination of a high ADX value with a wide spread between +DI and -DI suggests Pi Network is experiencing a particularly powerful uptrend with minimal selling pressure.
If these technical signals maintain their current configuration, they could indicate continued upward price movement for Pi in the near term, as the market appears to be under strong buying control with minimal resistance.
PI BBTrend Is Negative Despite the Price Surge
Despite the ongoing price surge, Pi’s Bollinger Bands Trend indicator (BBTrend) has plummeted to -11, marking a dramatic decline from its reading of 51.2 just three days ago, after hovering between 1 and 3 yesterday.
The BBTrend indicator is a specialized technical tool that measures price movement relative to Bollinger Bands. It essentially quantifies how price is trending within these volatility-based channels.
Positive readings indicate upward price movement relative to the bands, while negative values suggest downward movement or reversion toward the middle band.
 PI BBTrend. Source:
TradingView.
This sharp decline to -11 in Pi’s BBTrend could signal that the current uptrend is becoming significantly overextended and potentially vulnerable to a correction or consolidation phase.
When BBTrend turns notably negative after a price surge, it often indicates that the asset has moved too far too quickly and is now trading at levels that may be unsustainable in the short term.
This technical warning sign suggests that Pi might experience a pullback toward its middle Bollinger Band, a period of sideways consolidation, or at minimum, a deceleration in its upward momentum.
Can Pi Network Reach $4 In March?
Pi Network price reached new all-time highs just hours ago as its price approached the $3 mark for the first time.
With this strong upward momentum, Pi could potentially continue its ascent, breaking through the $3 psychological barrier and testing higher resistance levels at $3.5 or even $4 in the near term.
This impressive rally demonstrates growing market interest and buying pressure that could sustain further upside if the positive sentiment persists.
 PI Price Analysis. Source:
TradingView.
However, as indicated by the negative BBTrend reading, this rally may be overextended and at risk of reversal. Should the downward technical signal materialize into price action, Pi could experience a substantial correction, initially falling to test support at $1.7.
If this level fails to hold, further declines to $1.42 become likely as selling pressure intensifies.
In a scenario where a strong downtrend takes hold, Pi’s price might experience an even more dramatic pullback to $0.79, which would represent its lowest level in five days and a significant retracement from current highs.
Disclaimer: The content of this article solely reflects the author's opinion and does not represent the platform in any capacity. This article is not intended to serve as a reference for making investment decisions.
You may also like
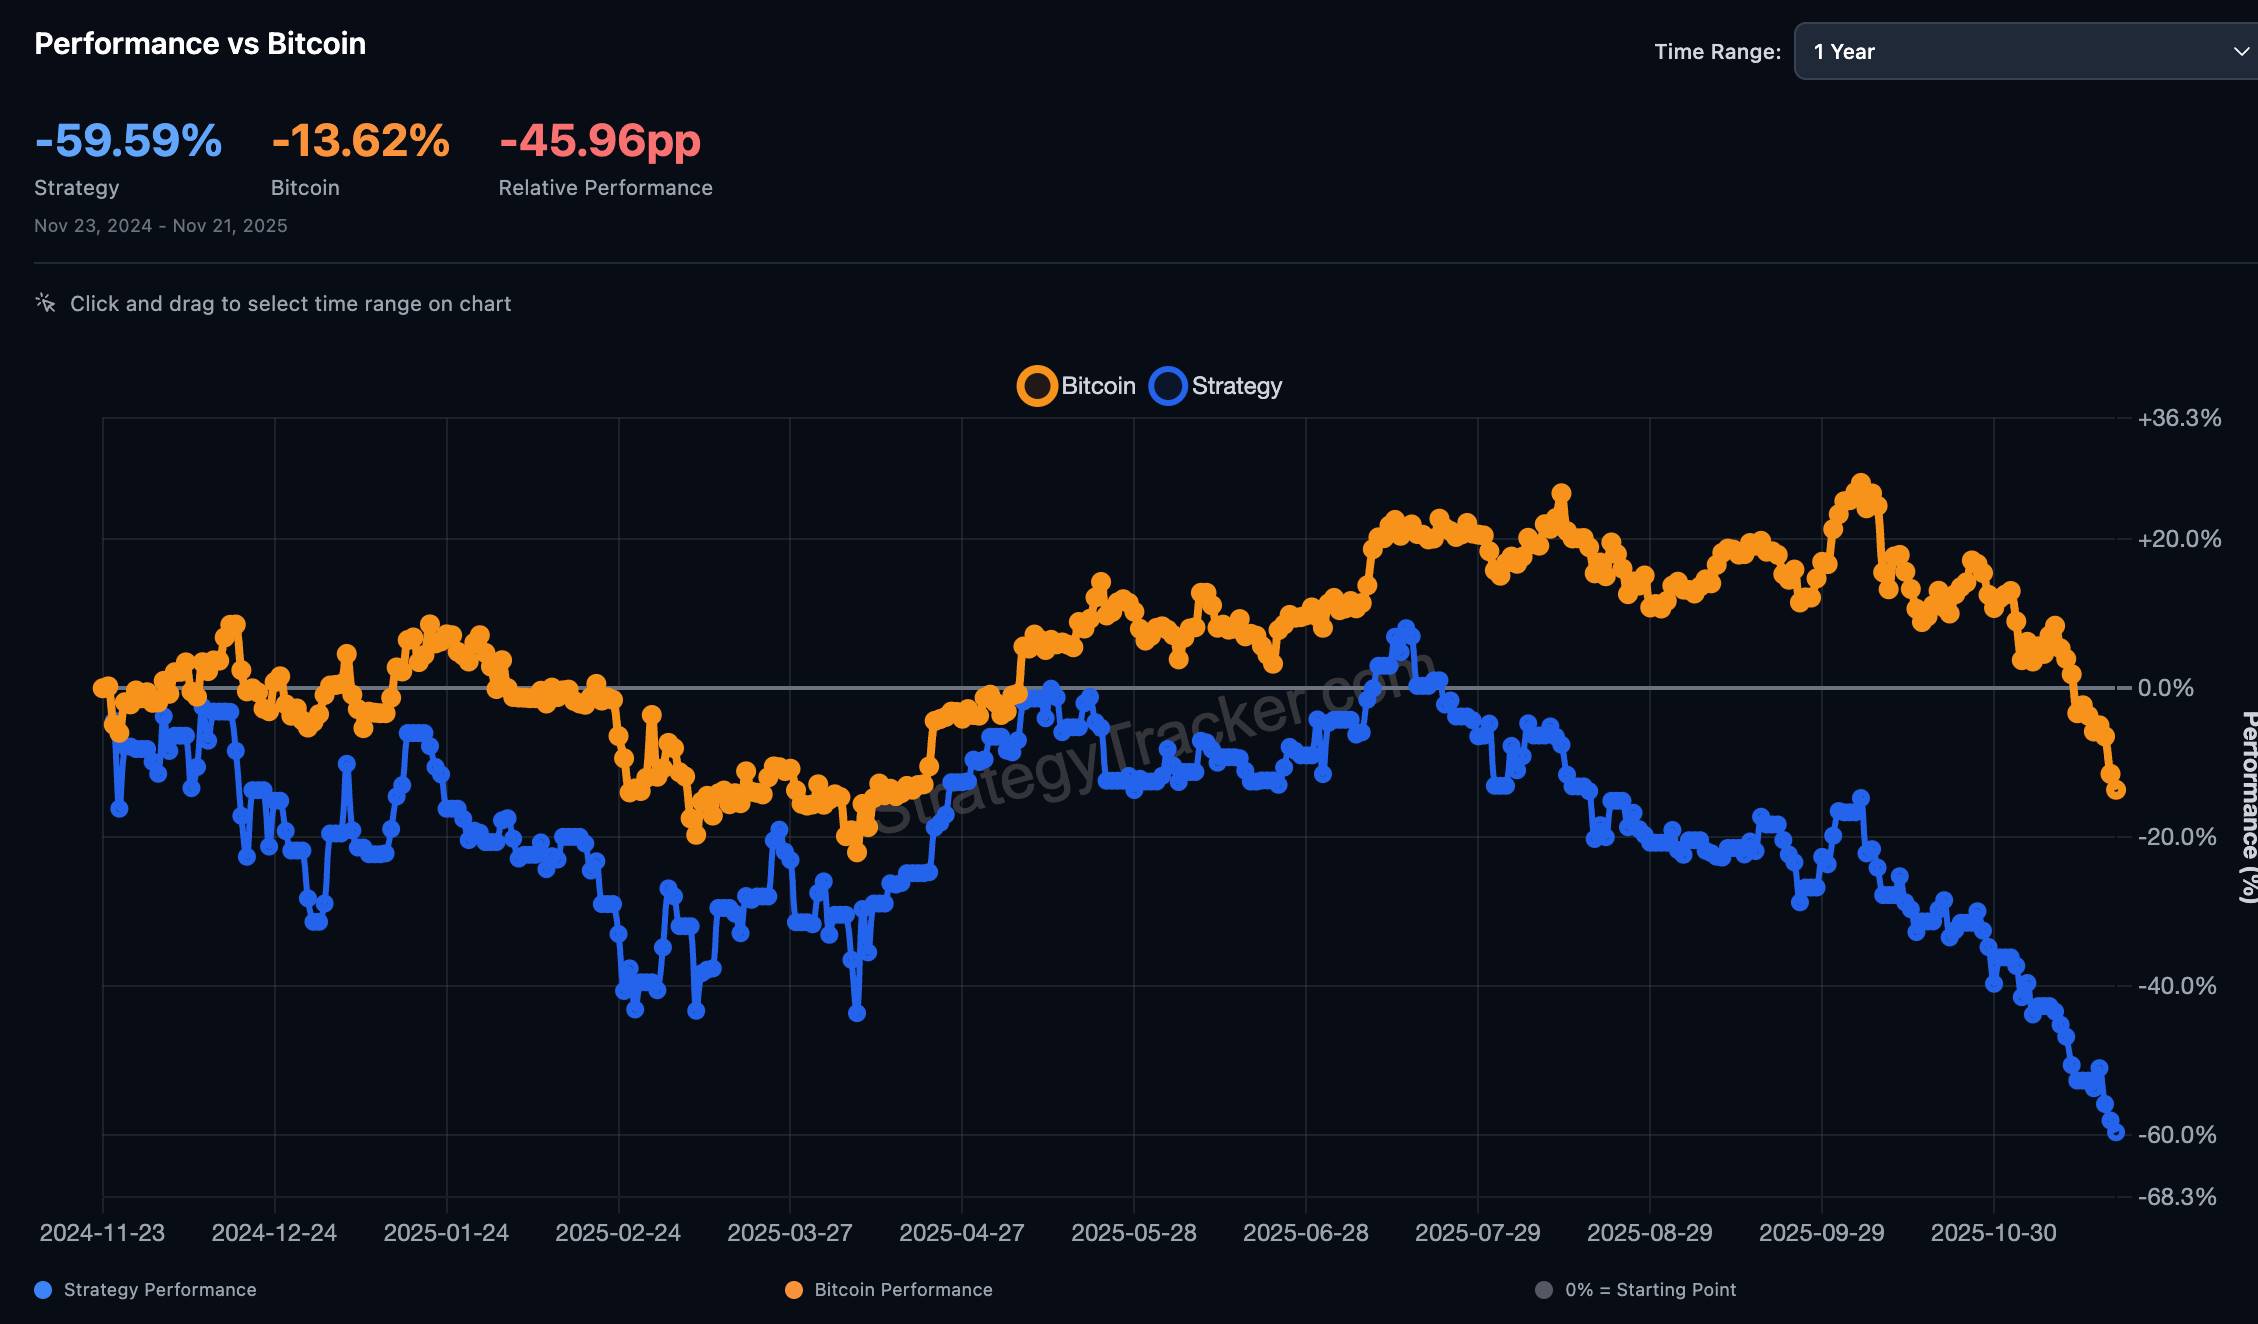
$8.8 billion outflow countdown: MSTR is becoming the abandoned child of global index funds
The final result will be revealed on January 15, 2026, and the market has already started to vote with its feet.

Deconstructing DAT: Beyond mNAV, How to Identify "Real vs. Fake HODLing"?
There is only one iron rule for investing in DAT: ignore premium bubbles and only invest in those with a genuine flywheel of continuously increasing "crypto per share."

Empowered by AI Avatars, How Does TwinX Create Immersive Interaction and a Value Closed Loop?
1. **Challenges in the Creator Economy**: Web2 content platforms suffer from issues such as opaque algorithms, non-transparent distribution, unclear commission rates, and high costs for fan migration, making it difficult for creators to control their own data and earnings. 2. **Integration of AI and Web3**: The development of AI technology, especially AI Avatar technology, combined with Web3's exploration of the creator economy, offers new solutions aimed at breaking the control of centralized platforms and reconstructing content production and value distribution. 3. **Positioning of the TwinX Platform**: TwinX is an AI-driven Web3 short video social platform that aims to reconstruct content, interaction, and value distribution through AI avatars, immersive interactions, and a decentralized value system, enabling creators to own their data and income. 4. **Core Features of TwinX**: These include AI avatar technology, which allows creators to generate a learnable, configurable, and sustainably operable "second persona", as well as a closed-loop commercialization pathway that integrates content creation, interaction, and monetization. 5. **Web3 Characteristics**: TwinX embodies the assetization and co-governance features of Web3. It utilizes blockchain to confirm and record interactive behaviors, turning user activities into traceable assets, and enables participants to engage in platform governance through tokens, thus integrating the creator economy with community governance.

Aster CEO explains in detail the vision of Aster privacy L1 chain, reshaping the decentralized trading experience
Aster is set to launch a privacy-focused Layer 1 (L1) public chain, along with detailed plans for token empowerment, global market expansion, and liquidity strategies.

