Date: Sun March 23, 2025 | 03:44 PM GMT
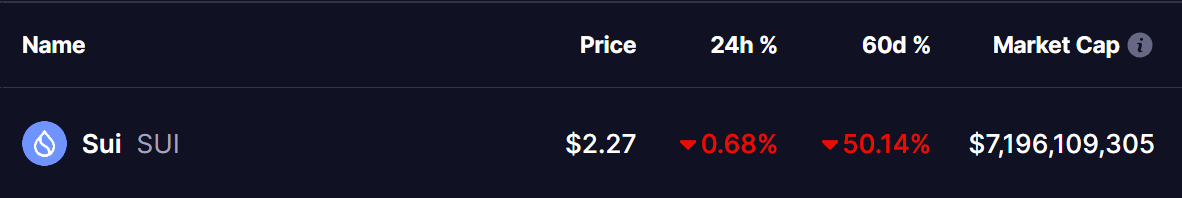
After making impressive rallies in late 2024, major altcoins suffered heavy losses, and the Layer 1 token Sui (SUI) was no exception. Over the past 60 days, SUI lost 50% of its value as selling pressure mounted. However, the broader crypto market is now showing signs of a rebound, with Ethereum (ETH) posting a 6% weekly gain, which has given altcoins some breathing room.
 Source: Coinmarketcap
Despite this, SUI has yet to regain its bullish momentum. However, a recent analysis by a prominent crypto chart analyst, Jonathan, suggests a potential upside move in the coming weeks.
SUI Forms Another Bullish Falling Wedge
According to Jonathan’s analysis, SUI has now formed its third falling wedge pattern on the 3-day chart, a classic bullish reversal signal. Historically, this pattern has led to significant breakouts in SUI’s price action. The previous two falling wedges resulted in explosive upward moves, and this time might not be any different.
Currently, SUI is consolidating near the $2.28 level, with the price respecting the lower trendline of the wedge. If this pattern plays out like before, a breakout above the descending resistance could trigger a major rally toward key resistance levels at $3.95 and $5.15. A successful push above these levels could set the stage for an all-time high attempt beyond $8.00 in the long run.
Additionally, the RSI indicator shows a rebound from oversold conditions, hinting at a potential shift in momentum. If buying pressure increases, the price may soon break out of its current structure and enter a new bullish phase.
Final Thoughts
SUI’s falling wedge pattern suggests growing bullish momentum, but the price may still consolidate before making a decisive breakout attempt. A successful breakout could drive SUI toward new highs, while failure to hold key levels might result in extended sideways movement or a retest of lower supports. With market sentiment improving and altcoins showing signs of recovery, the coming weeks will be critical in determining whether SUI can sustain a bullish reversal.
Disclaimer: This article is for informational purposes only and not financial advice. Always conduct your own research before investing in cryptocurrencies.