Solana Price Ready to Explode or Fakeout Incoming?

Solana (SOL) , one of the top-performing altcoins of the last cycle, is now facing a critical technical moment. After a turbulent start to 2025 marked by a prolonged downtrend, the token is showing early signs of a potential trend shift. With recent price stabilization and a gradual climb from local lows, traders and investors alike are watching closely for the next big move. Is Solana preparing for a breakout that could reignite bullish momentum, or is this just another deceptive bounce before further downside? Let’s dive into the charts and indicators to find out what’s next.
Solana Price Prediction: Is Solana Price Gearing Up for a Major Trend Reversal?
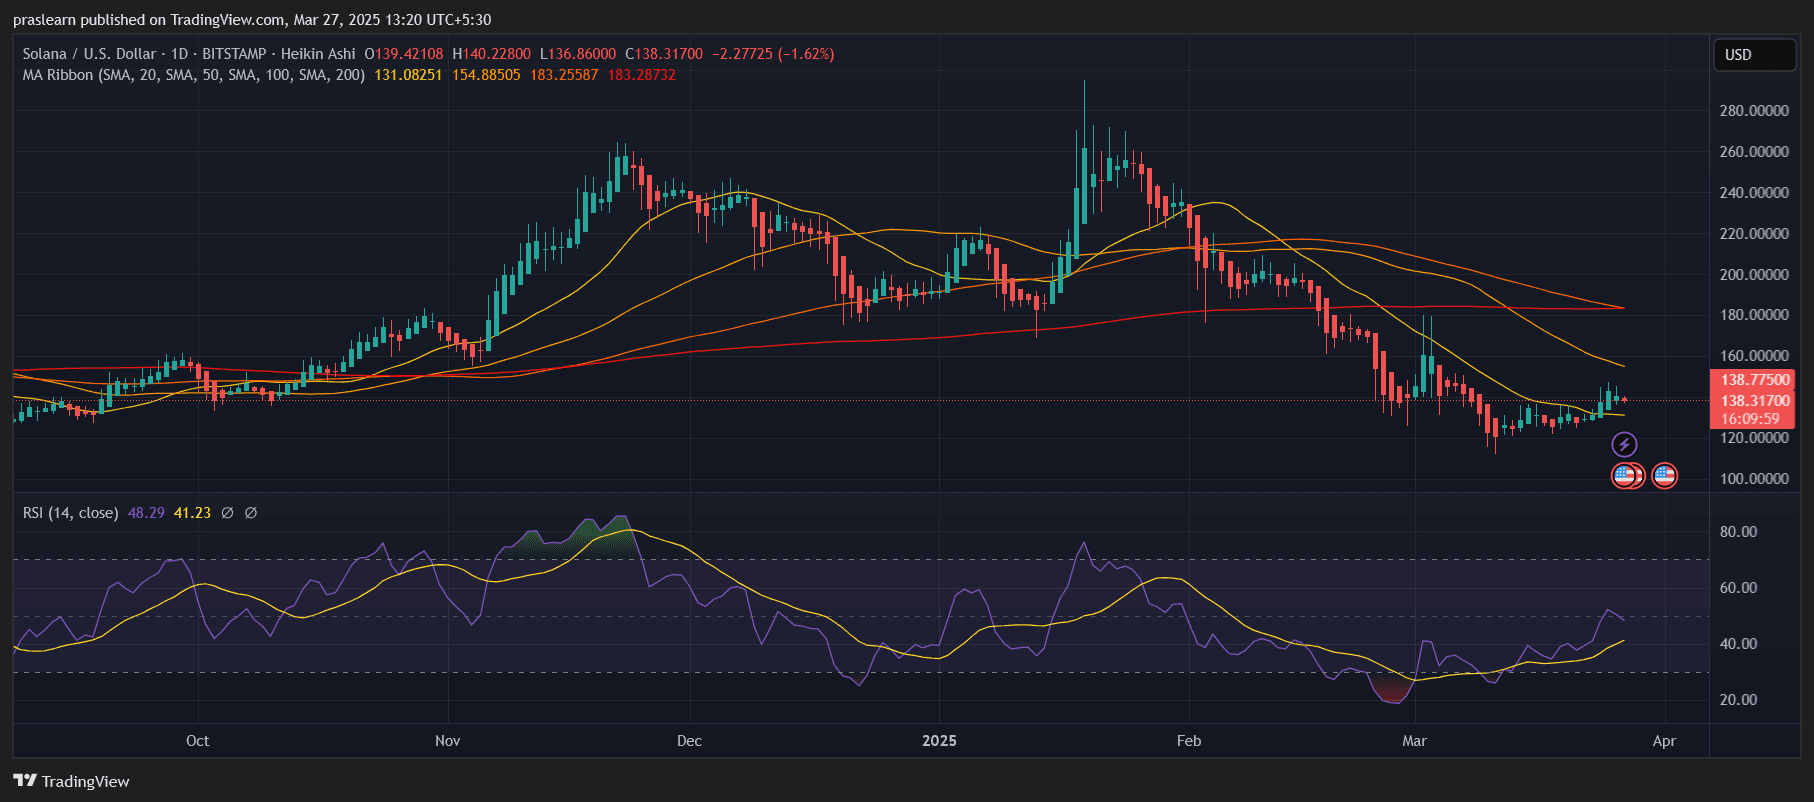 SOL/USD Daily Chart- TradingView
Solana (SOL) has been slowly climbing out of a multi-week downtrend that began after its local high near $210 in late December 2024. After bottoming out near the $120 level in early March, SOL price has shown signs of stabilization. This latest consolidation phase hints at an impending breakout—or a potential fakeout that could catch traders off guard.
On the daily chart, SOL price has reclaimed the 20-day Simple Moving Average (SMA) and is attempting to establish support above it. However, the price is still below the 50-day and 100-day SMAs, which currently act as dynamic resistance levels near $154 and $183, respectively. The 200-day SMA—hovering at approximately $183.28—remains a long-term ceiling, emphasizing that SOL still needs to prove itself before a full-blown bullish trend resumes.
>>Click Here to Buy Solana on Bitget<<
Is Momentum Building or Stalling?
Momentum indicators paint a mixed picture. The Relative Strength Index (RSI) sits at 48.29, marginally below the neutral 50 mark. While this shows recovery from the oversold levels seen earlier in March, it also reflects hesitation. RSI’s inability to push above 50 suggests that buying pressure remains tentative, and a sharp move in either direction could follow.
It’s worth noting that the RSI has formed a higher low, which typically precedes a price rally. But for confirmation, the RSI must break above 55–60 territory. Until then, the risk of range-bound or downward movement still lingers.
What Are the Key Resistance and Support Levels to Watch?
On the support side, $130 stands out as the immediate psychological and technical level. If SOL fails to hold above this zone, the next major demand region lies around $120, where the recent bottom was formed.
On the upside, the $145–$155 range represents the first major challenge, aligning with both price structure and the 50-day SMA. A clean breakout above this band would open the gates to $170 and potentially retest $183—where the 200-day SMA looms. A daily close above $183 would be a strong bullish signal, possibly triggering a momentum-driven rally toward $200+ levels.
>>Click Here to Buy Solana on Bitget<<
Could a Breakout Be Imminent or Is It a Bull Trap?
The current chart structure resembles a rounded bottom pattern with a tightening price range. This pattern often precedes a breakout move, and the confluence of narrowing candles with rising volume could confirm such a move soon. However, without a decisive close above $155 and sustained buying pressure, the risk of a bull trap remains high.
Volume analysis and RSI divergence will be critical in the next few sessions. If buyers step in strongly on higher-than-average volume while RSI climbs above 50, it may validate a genuine breakout. On the contrary, a failed test of the $145–$150 resistance zone followed by a breakdown below $130 would likely trigger a retest of March lows.
Solana Price Prediction: What's Next?
If bulls manage to push Solana price above $155 in the next few days, the next price target lies around $170, with a bullish extension potentially reaching $200 within the next few weeks. However, failure to do so could result in a pullback toward $130 or even $120 before any sustainable rally takes place.
Overall, Solana is at a pivotal technical juncture. The price is compressing between short-term moving averages and horizontal resistance, indicating a strong move is imminent. Whether it's upward or downward depends on how price reacts to the $145–$155 resistance range in the coming sessions.
Disclaimer: The content of this article solely reflects the author's opinion and does not represent the platform in any capacity. This article is not intended to serve as a reference for making investment decisions.
You may also like
$8.8 billion outflow countdown: MSTR is becoming the abandoned child of global index funds
The final result will be revealed on January 15, 2026, and the market has already started to vote with its feet.
Deconstructing DAT: Beyond mNAV, How to Identify "Real vs. Fake HODLing"?
There is only one iron rule for investing in DAT: ignore premium bubbles and only invest in those with a genuine flywheel of continuously increasing "crypto per share."

Empowered by AI Avatars, How Does TwinX Create Immersive Interaction and a Value Closed Loop?
1. **Challenges in the Creator Economy**: Web2 content platforms suffer from issues such as opaque algorithms, non-transparent distribution, unclear commission rates, and high costs for fan migration, making it difficult for creators to control their own data and earnings. 2. **Integration of AI and Web3**: The development of AI technology, especially AI Avatar technology, combined with Web3's exploration of the creator economy, offers new solutions aimed at breaking the control of centralized platforms and reconstructing content production and value distribution. 3. **Positioning of the TwinX Platform**: TwinX is an AI-driven Web3 short video social platform that aims to reconstruct content, interaction, and value distribution through AI avatars, immersive interactions, and a decentralized value system, enabling creators to own their data and income. 4. **Core Features of TwinX**: These include AI avatar technology, which allows creators to generate a learnable, configurable, and sustainably operable "second persona", as well as a closed-loop commercialization pathway that integrates content creation, interaction, and monetization. 5. **Web3 Characteristics**: TwinX embodies the assetization and co-governance features of Web3. It utilizes blockchain to confirm and record interactive behaviors, turning user activities into traceable assets, and enables participants to engage in platform governance through tokens, thus integrating the creator economy with community governance.
Aster CEO explains in detail the vision of Aster privacy L1 chain, reshaping the decentralized trading experience
Aster is set to launch a privacy-focused Layer 1 (L1) public chain, along with detailed plans for token empowerment, global market expansion, and liquidity strategies.