-
Ethereum (ETH) is currently facing a critical trading range as market dynamics shift and leverage positions increase among investors.
-
As whale activity signals mixed sentiment, the network’s underlying metrics suggest a precarious moment for bulls and bears amid fluctuating on-chain data.
-
The latest insights from IntoTheBlock reveal that significant ETH trading volume is concentrated between key supply zones, indicating where market participants are most active.
This article analyses Ethereum’s current market conditions, highlighting whale activities, leverage trends, and the implications of declining burn rates as ETH trades cautiously between $1,540 and $1,630.
Ethereum’s Trading Landscape: Key Zones and Market Sentiment
Ethereum (ETH) is caught in a delicate balance, trading between $1,540 and $1,630, as on-chain data reflects a noteworthy concentration of buying activity. Specifically, more than 7.9 million ETH has been purchased within this critical range, making it a battleground for prevailing market forces. The last day’s fluctuations have seen prices dip by just 0.37%, demonstrating minimal volatility but setting the stage for potential breakout scenarios.
Volatile Compression: Analyzing Support and Resistance Levels
The IOMAP chart illustrates that robust support exists in the $1,513 to $1,585 range, where over 6.6 million ETH is held “in the money.” However, potential resistance is notable above $1,630, with 3.37 million addresses holding positions at a loss. Such clusters reveal critical zones that ETH must surpass before any significant price movement can occur.
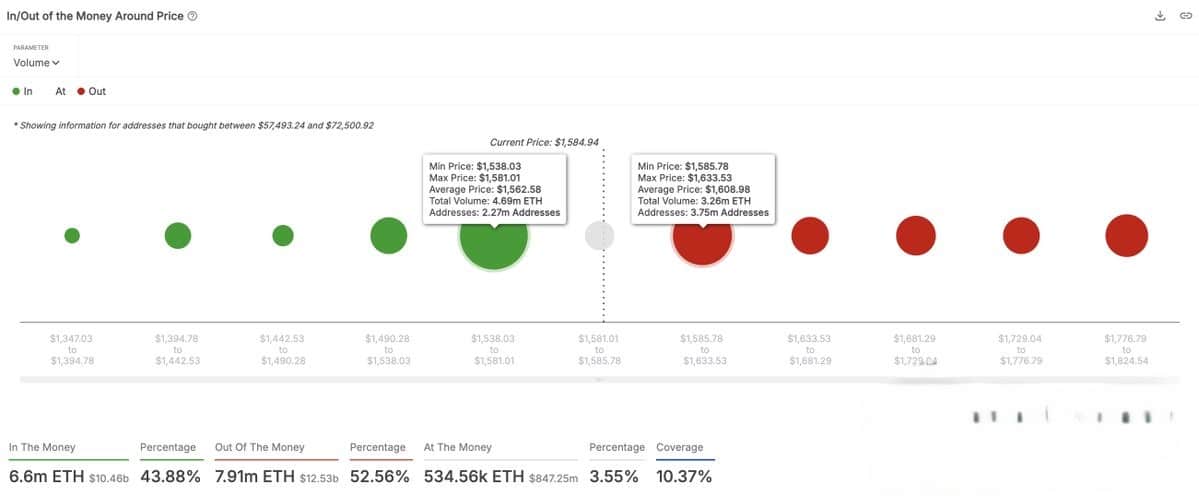
Source: IntoTheBlock
Technical Analysis: Will ETH Break Its Downtrend?
A thorough examination of ETH’s technical framework shows that it is trapped within a descending channel that has persisted since January 2025. Each time ETH approaches the upper resistance of $1,630, bearish momentum overrides bullish attempts to gain ground.
As ETH navigates the channel midline, the necessity for buyers to breach $1,630 becomes increasingly critical for reversing the prevailing bearish trend. Should this pattern continue, the targeted support at $1,475 could materialize as a potential downside risk.
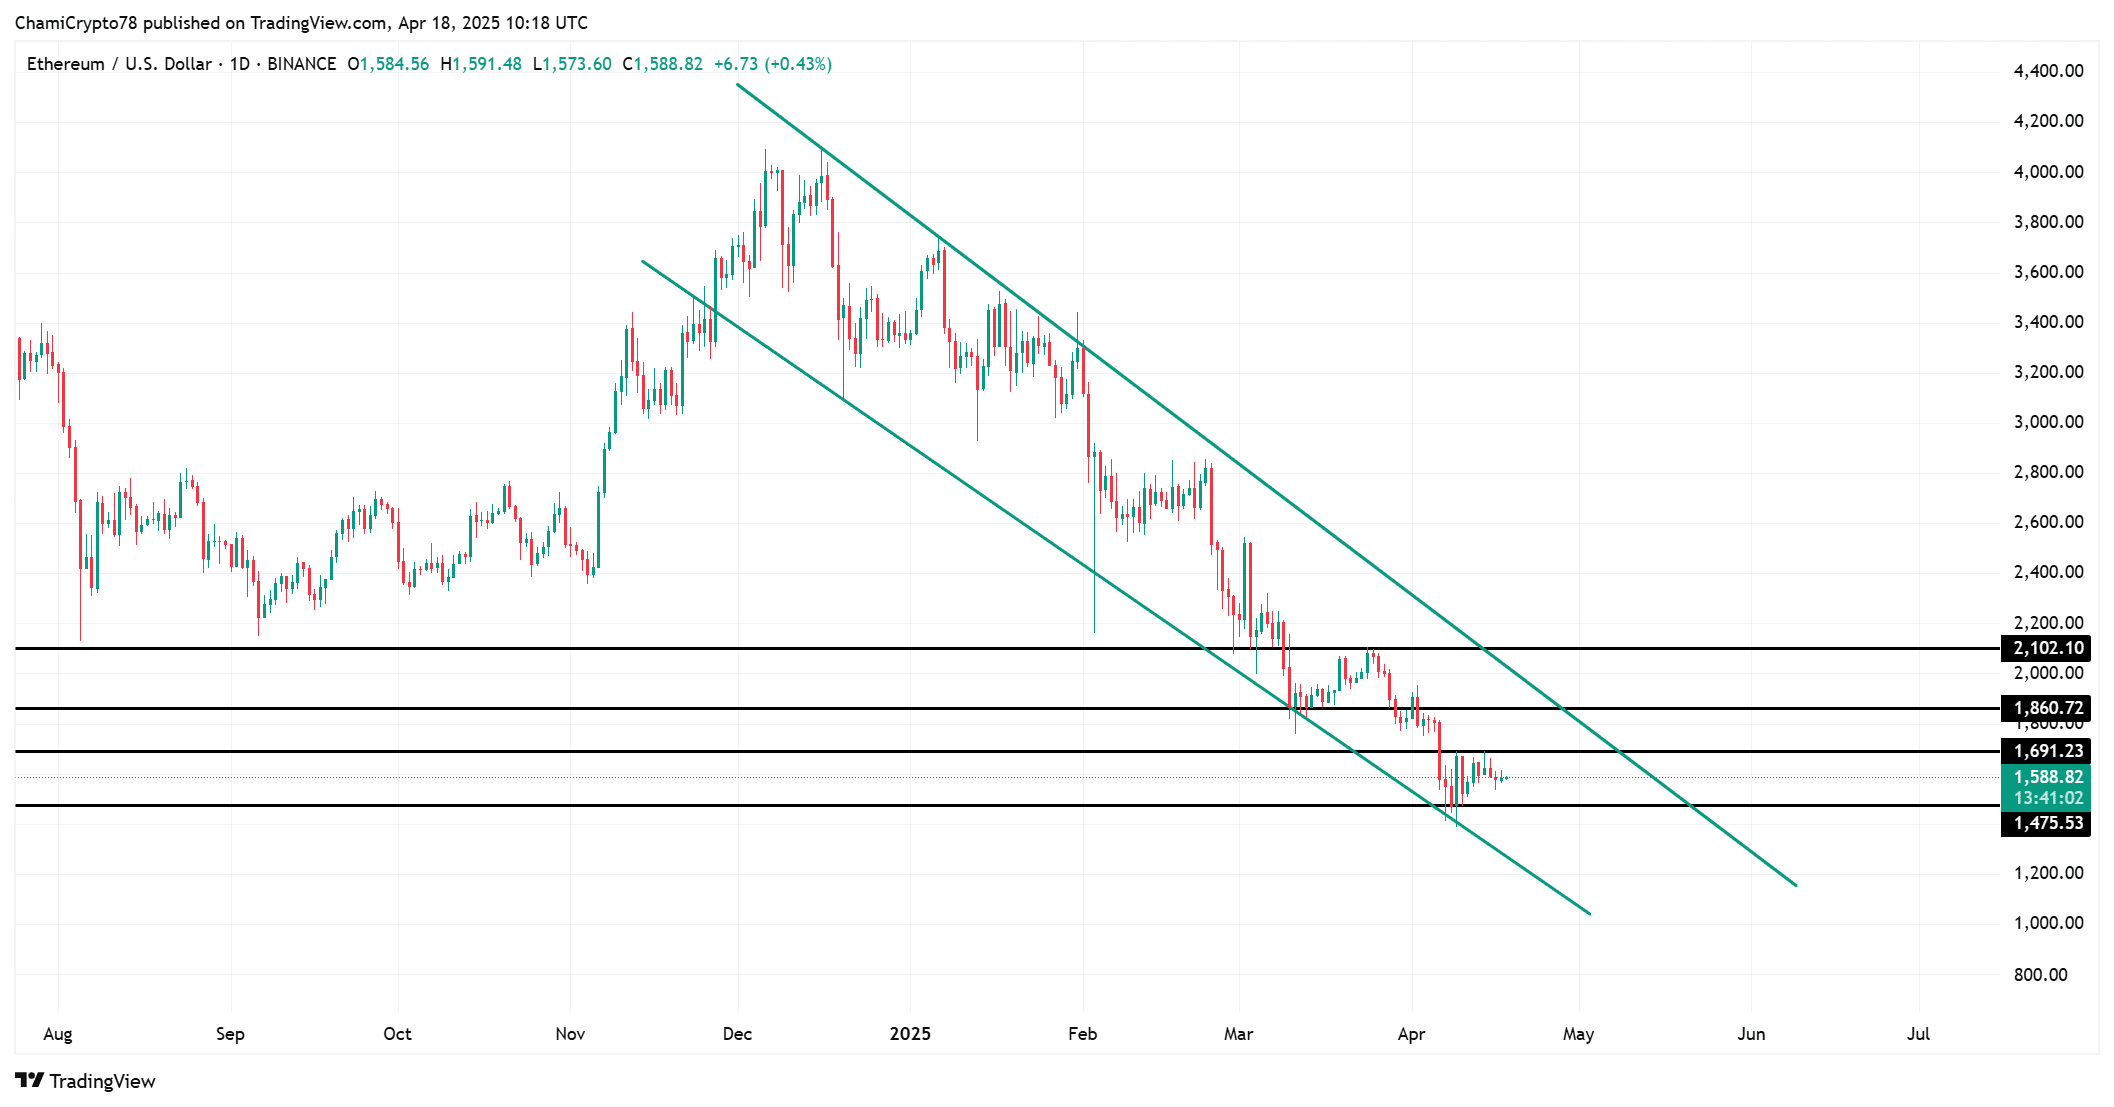
Source: TradingView
Whale Activity and Leverage Trends: Indicators of Market Moves?
Recent data shows that whale activity displays a complex narrative. Within the past week, net inflows from large holders rose by 10.76%, indicating a level of minor accumulation. Conversely, a sharp decline of 46.70% over the past 30 days suggests recent heavy distribution efforts. The long-term (90-day) trend is slightly positive, with netflows hovering at +1.77%.
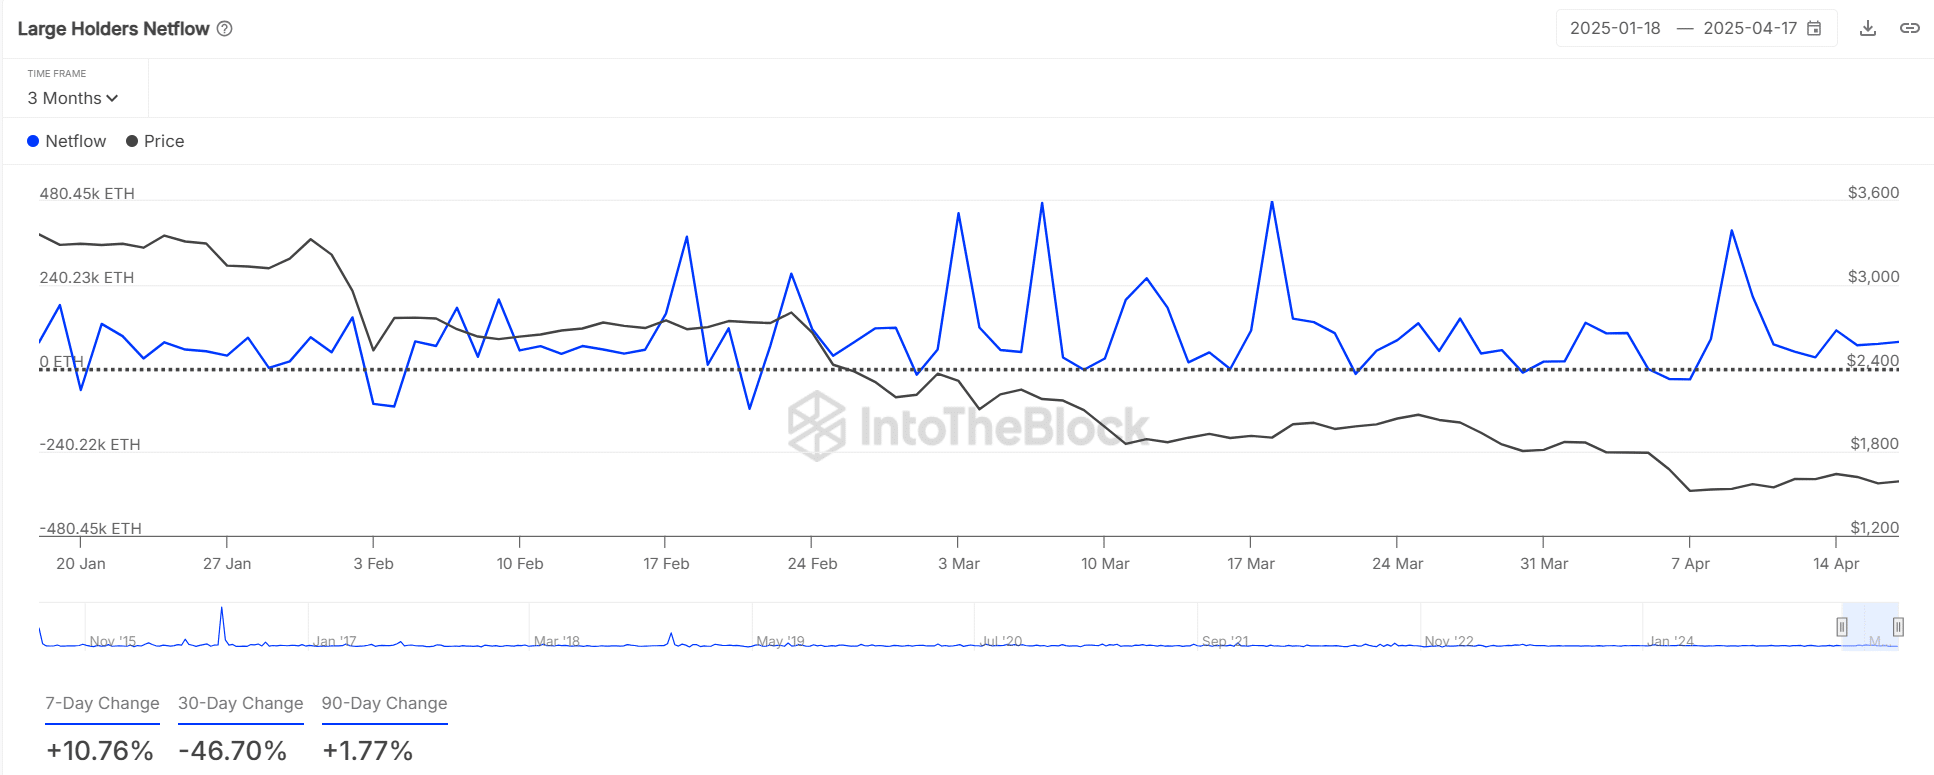
Source: IntoTheBlock
The estimated leverage ratio has increased to 0.7009, reflecting a surge in speculative trading interest. A decisive breakout could potentially trigger a volatility surge as liquidations may occur across exchanges.
Declining Burn Rates: Impact on Ethereum’s Deflationary Mechanics
The reduction in ETH’s burn rate is alarming, with the 7-day average dropping to 27.08%—well below the 90-day average of 42.38%. This trend suggests waning network activity and diminished demand, weakening ETH’s deflationary appeal.
Without revitalization in on-chain activity, the likelihood of sustained bullish momentum could diminish significantly.
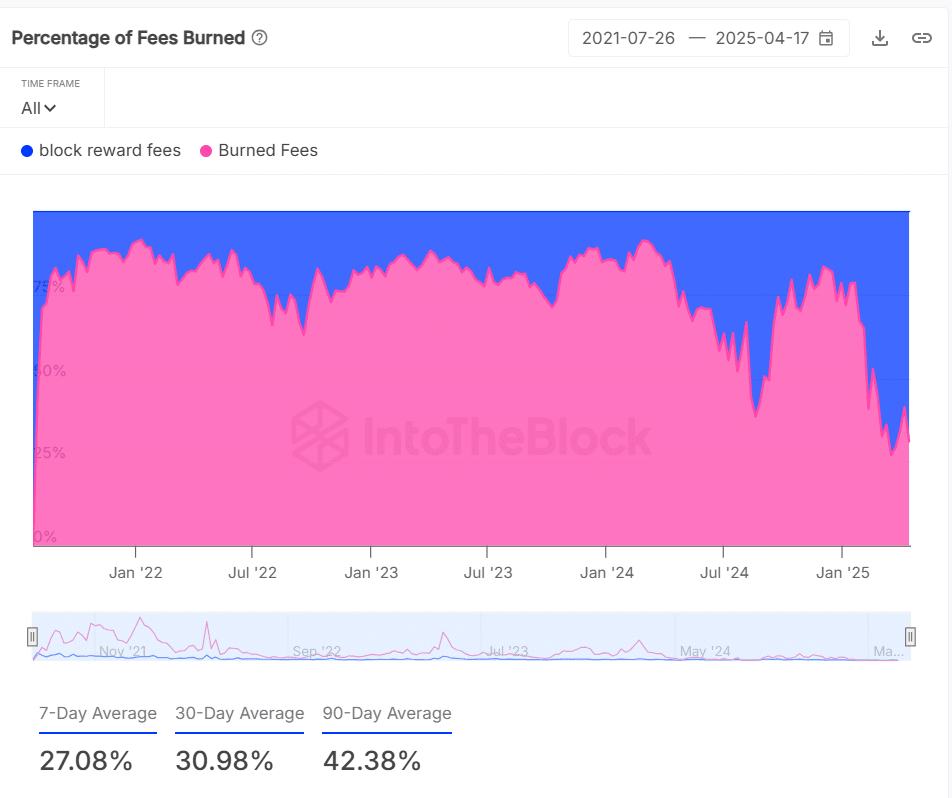
Source: IntoTheBlock
Ethereum is indeed at a pivotal juncture. Current price action intertwined with whale behavior and on-chain signals indicate potential for a significant price move. However, the prevailing bearish pressure, reduced burn rate, and rising leverage urge bulls to assert control swiftly, lest ETH faces heightened risks. A breakout above $1,630 could propel prices towards $1,860, while failure to maintain support at $1,540 may lead to swift corrections targeting $1,475.
Conclusion
In summary, Ethereum is navigating a precarious market environment shaped by whale participation, pivotal support and resistance zones, and declining burn rates. Market participants should monitor these indicators closely as they could dictate the next moves in ETH’s price trajectory.