
PI Network (PI) Eyes Revisit of $0.40 All-Time Low as Bearish Pressure Mounts

PI token price faces continued bearish pressure, risking a drop back to $0.40, though a recovery to $1.01 remains possible with renewed demand.
PI has been on a steady downtrend since February 26, shedding 72% of its value as bearish sentiment continues to weigh on the token.
Bearish pressure continues to mount on the PI token, suggesting that it may be poised to enter a new phase of decline.
PI Network Risks Fresh Decline
An assessment of the PI/USD one-day chart reveals that token holders remain steadfast in their distribution. At press time, PI’s Balance of Power (BoP) is negative, reflecting the selling pressure in the market.
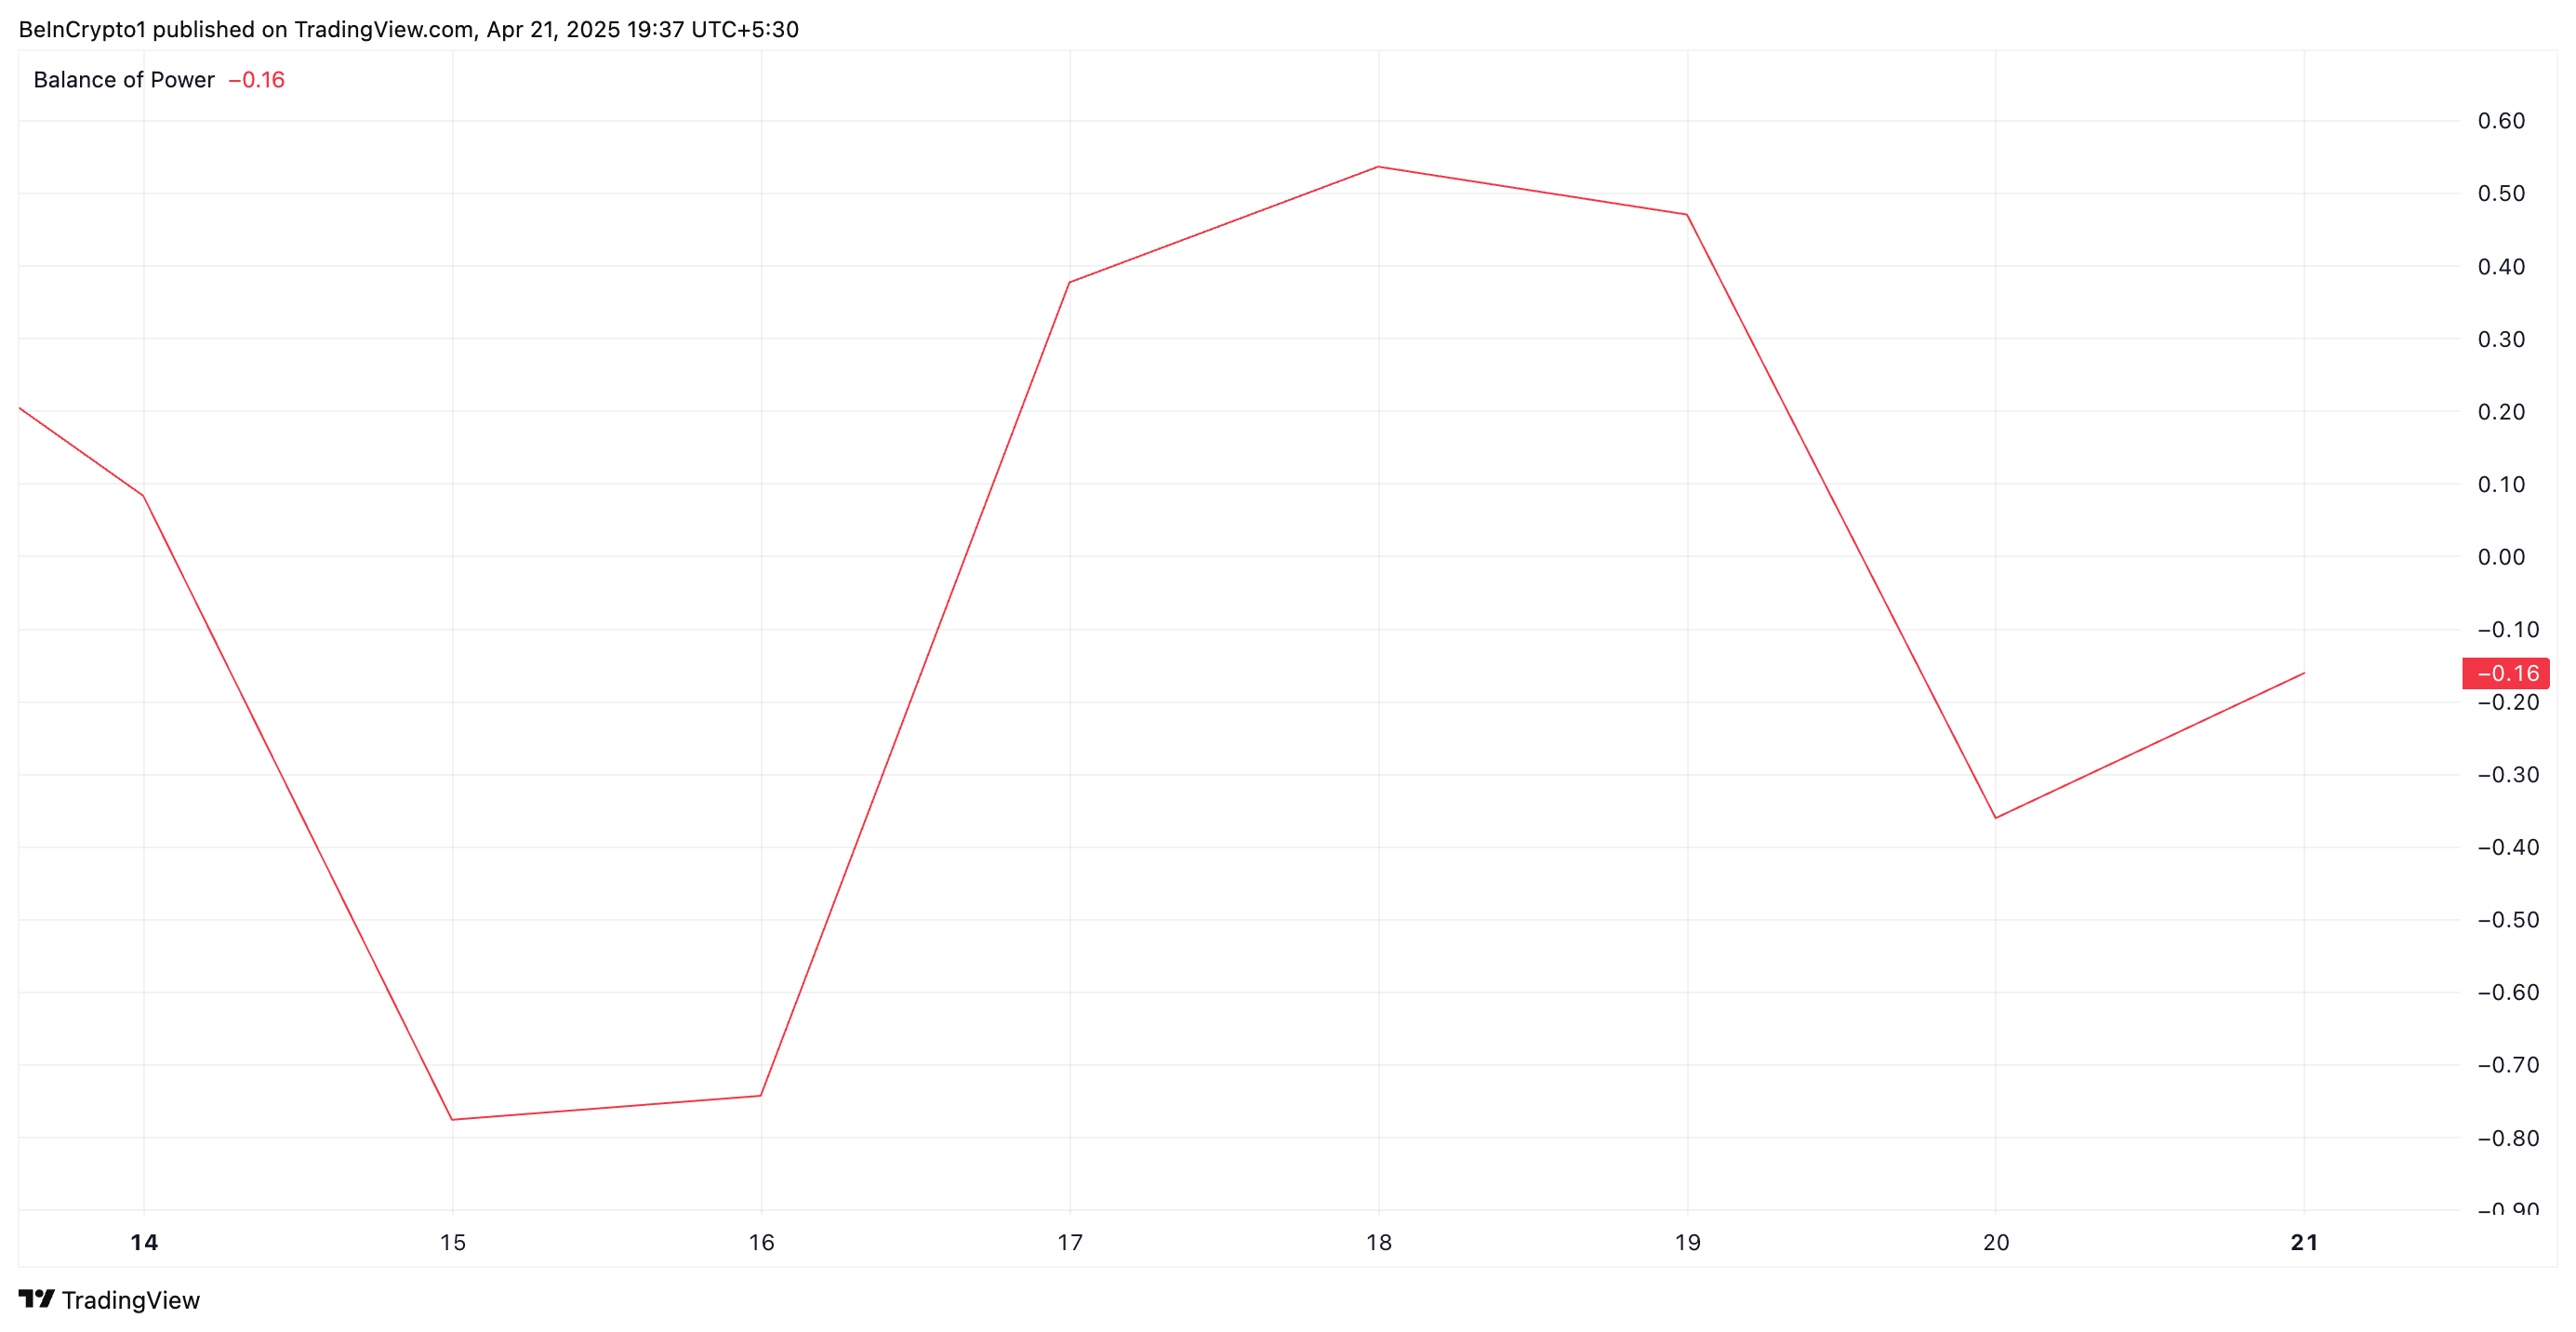 PI BoP. Source:
TradingView
PI BoP. Source:
TradingView
The BoP indicator measures the strength of buying versus selling pressure by comparing the close price to the trading range within a given period. When BOP is negative like this, it indicates that sellers are dominating the market, suggesting downward pressure on the asset’s price.
Further, the setup of PI’s Chaikin Money Flow (CMF) supports this bearish outlook. At press time, this is below the central line at -0.12.
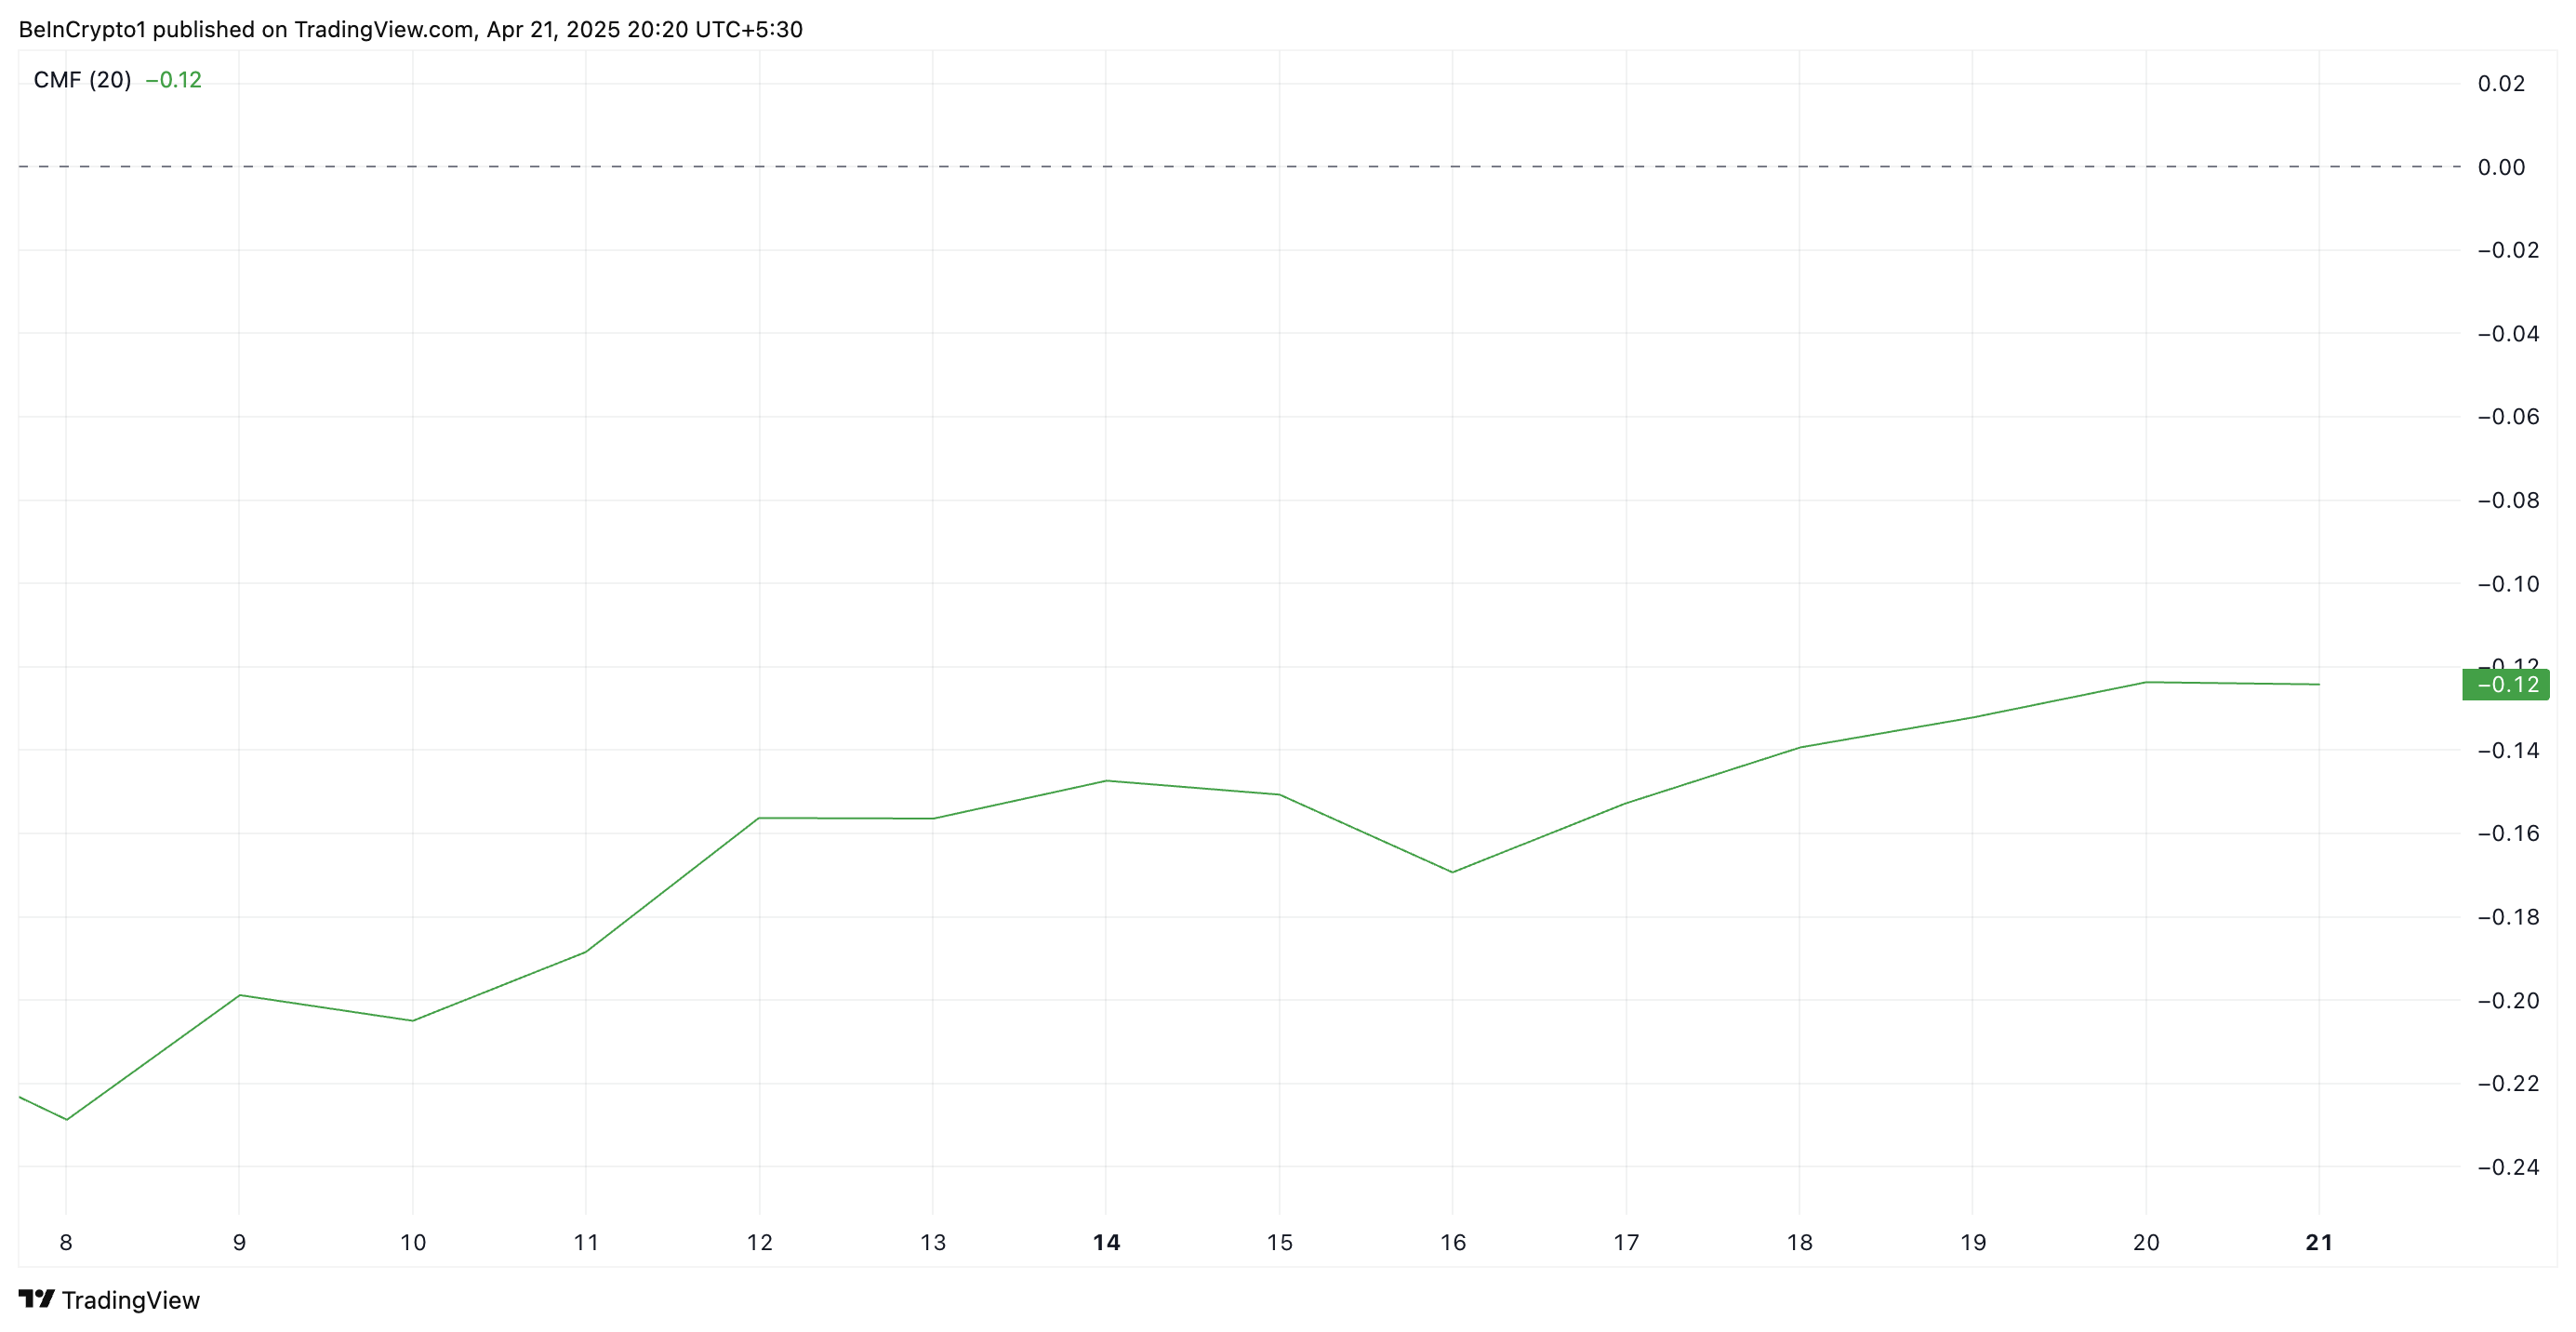 PI CMF. Source: TradingView
The CMF indicator measures an asset’s buying and selling pressure. A negative CMF reading suggests that the asset is experiencing more selling pressure than buying pressure. This means PI traders are distributing rather than accumulating. This signals bearish sentiment and confirms the downward momentum in the token’s price.
Sellers Tighten Grip on PI, But Recovery to $1.01 Still on the Table
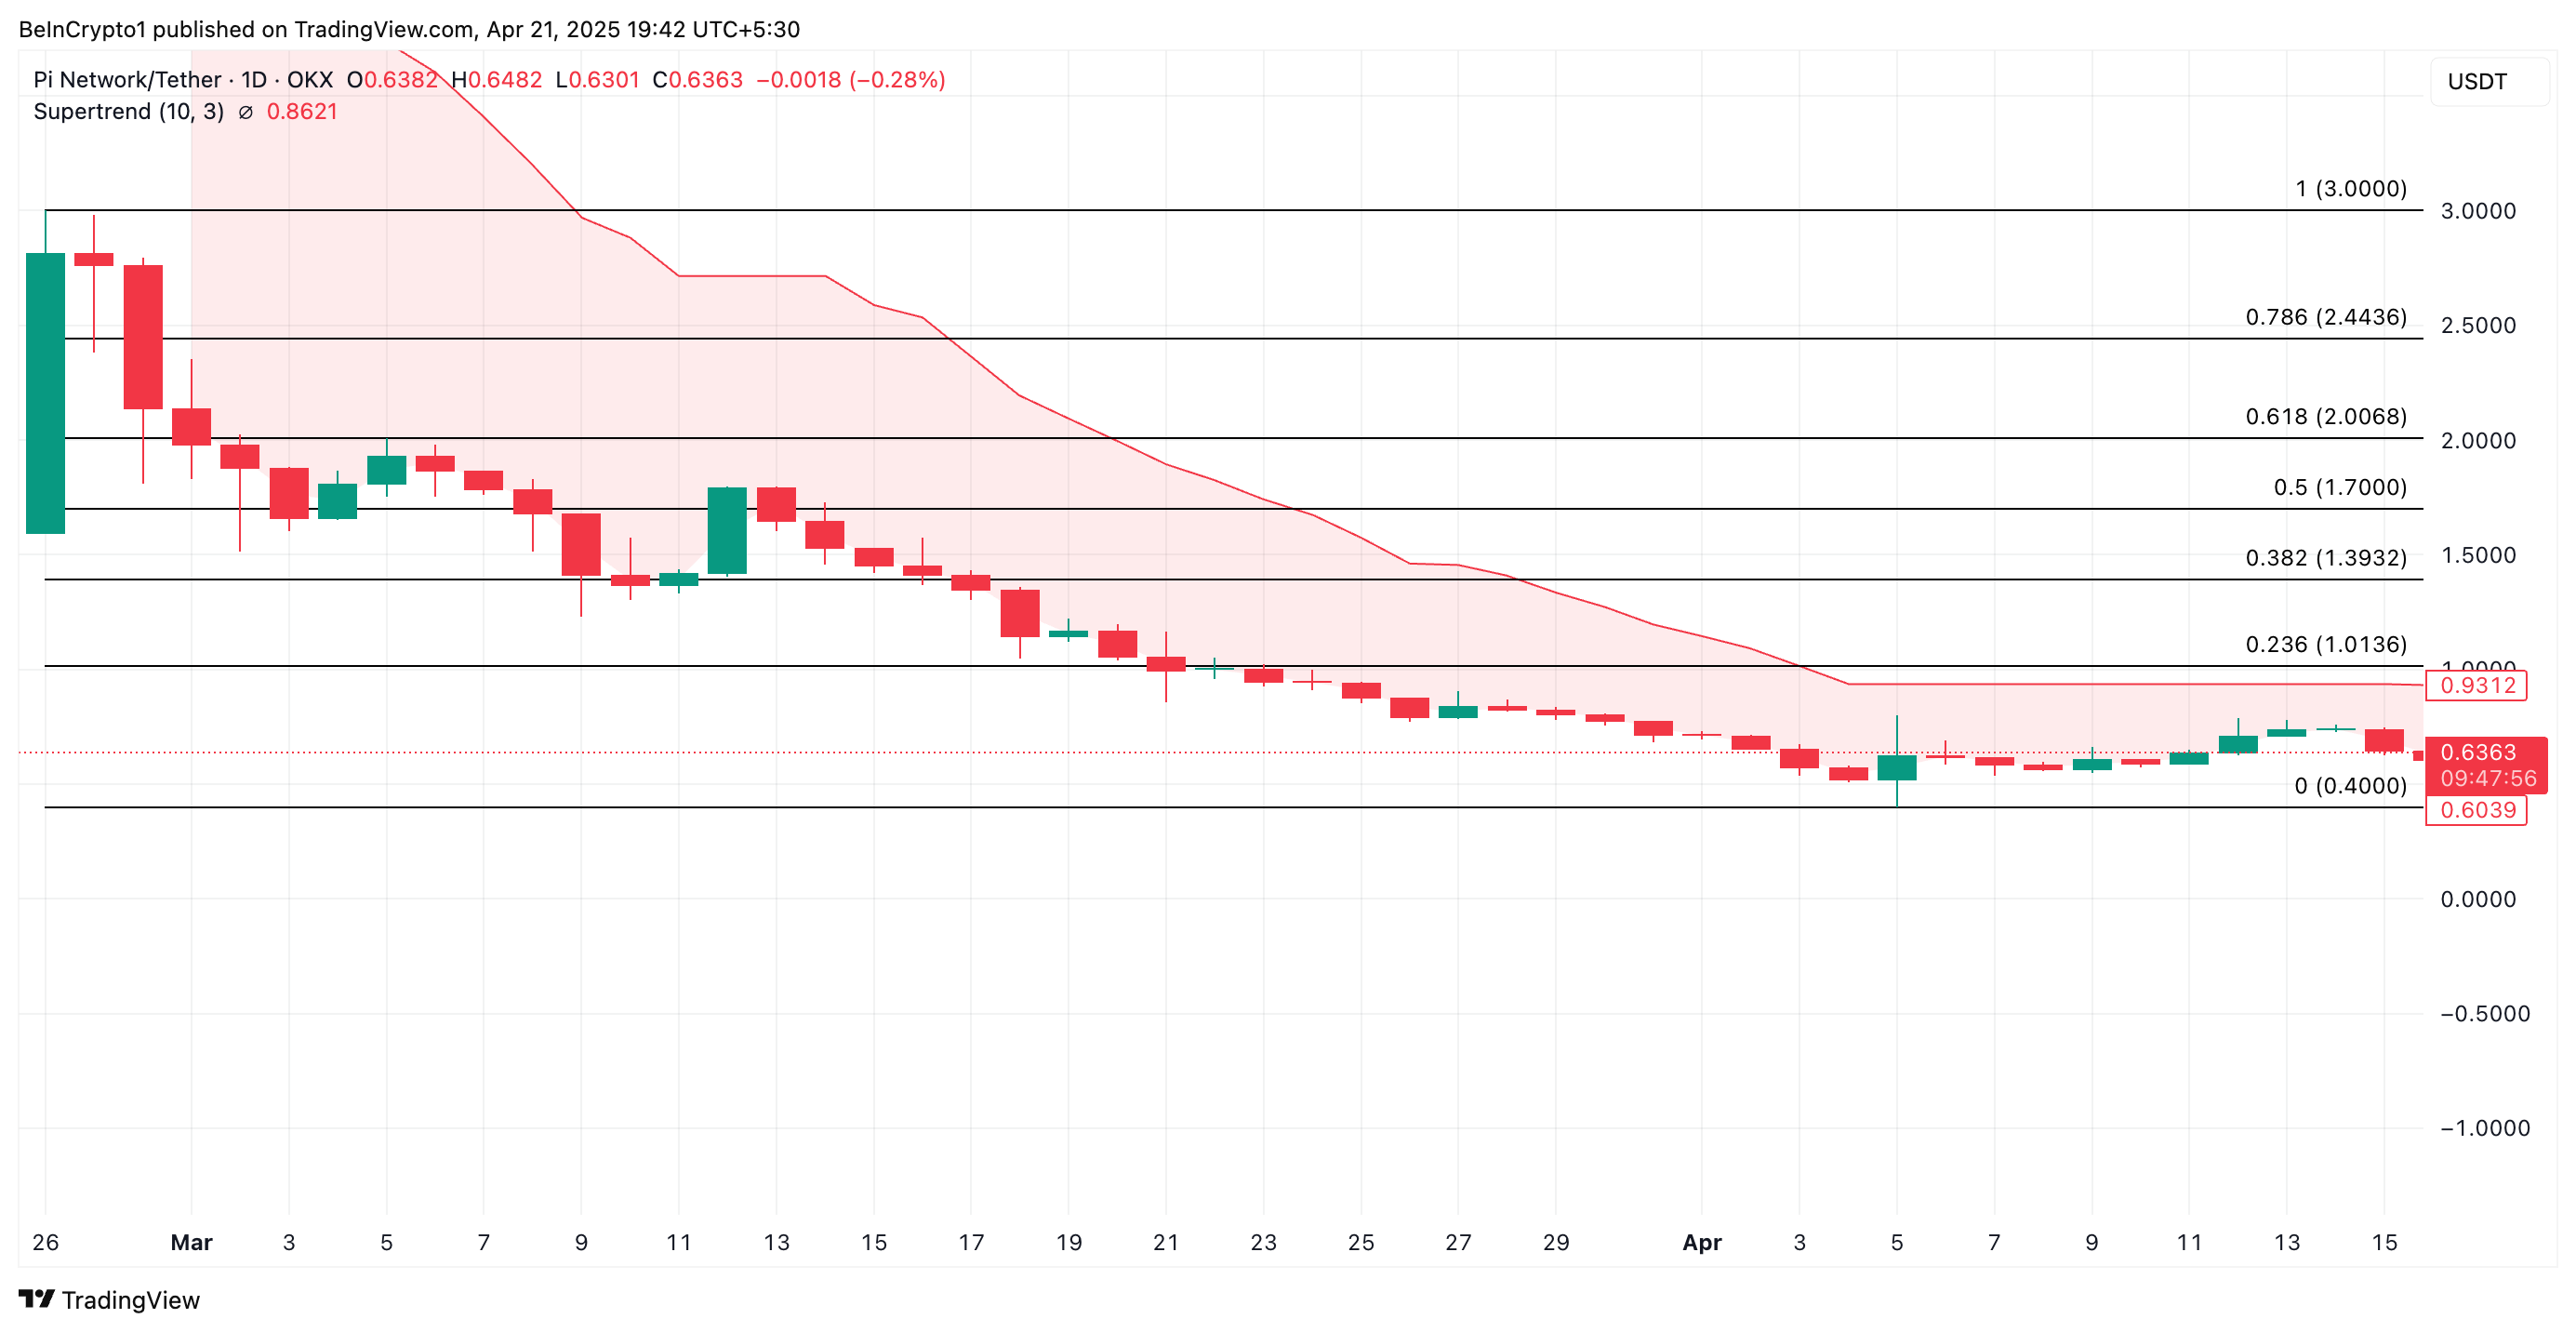
At press time, PI trades at $0.63, below the dynamic support formed above it at $0.93 by its Super Trend indicator.
The Super Trend indicator helps traders identify the market’s direction by placing a line above or below the price chart based on the asset’s volatility.
When an asset’s price trades below the Super Trend line like this, it signals a bearish trend and hints at potential decline. If PI’s decline strengthens, it could revisit its all-time low of $0.40.
 PI Super Trend Indicator. Source: TradingView
However, if demand returns to the PI market, its price could break above the resistance at $0.86 and surge to $1.01.
Disclaimer: The content of this article solely reflects the author's opinion and does not represent the platform in any capacity. This article is not intended to serve as a reference for making investment decisions.
You may also like
Bitcoin’s “Silent IPO”: A Sign of Market Maturity and Future Implications
AiCoin Daily Report (November 15)
Surviving Three Bull and Bear Cycles, Dramatic Revival, and Continuous Profits: The Real Reason Curve Became the “Liquidity Hub” of DeFi
Curve Finance has evolved from a stablecoin trading platform into a cornerstone of DeFi liquidity through its StableSwap AMM model, veTokenomics, and strong community resilience, demonstrating a sustainable development path. Summary generated by Mars AI. The accuracy and completeness of this summary, generated by the Mars AI model, are still in the process of iterative improvement.

![[Bitpush Daily News Selection] Financial Times: Tether is considering leading a funding round of approximately $1.16 billion for German tech startup Neura Robotics; the US SEC has issued post-shutdown document processing guidance, and multiple crypto ETFs may be expedited; US Bureau of Labor Statistics: September 2025 employment data will be released on November 20, and October state employment and unemployment data will be released on November 21.](https://img.bgstatic.com/multiLang/image/social/06829a455cc5ced5cafaf4b9bf53d5281763243641786.png)