PI Plummets 50% in a Week; Why Traders Should Brace for More Downside

PI has sharply declined, facing strong selling pressure and resistance near the 20-day EMA. Indicators hint at continued weakness or a possible short-term bounce.
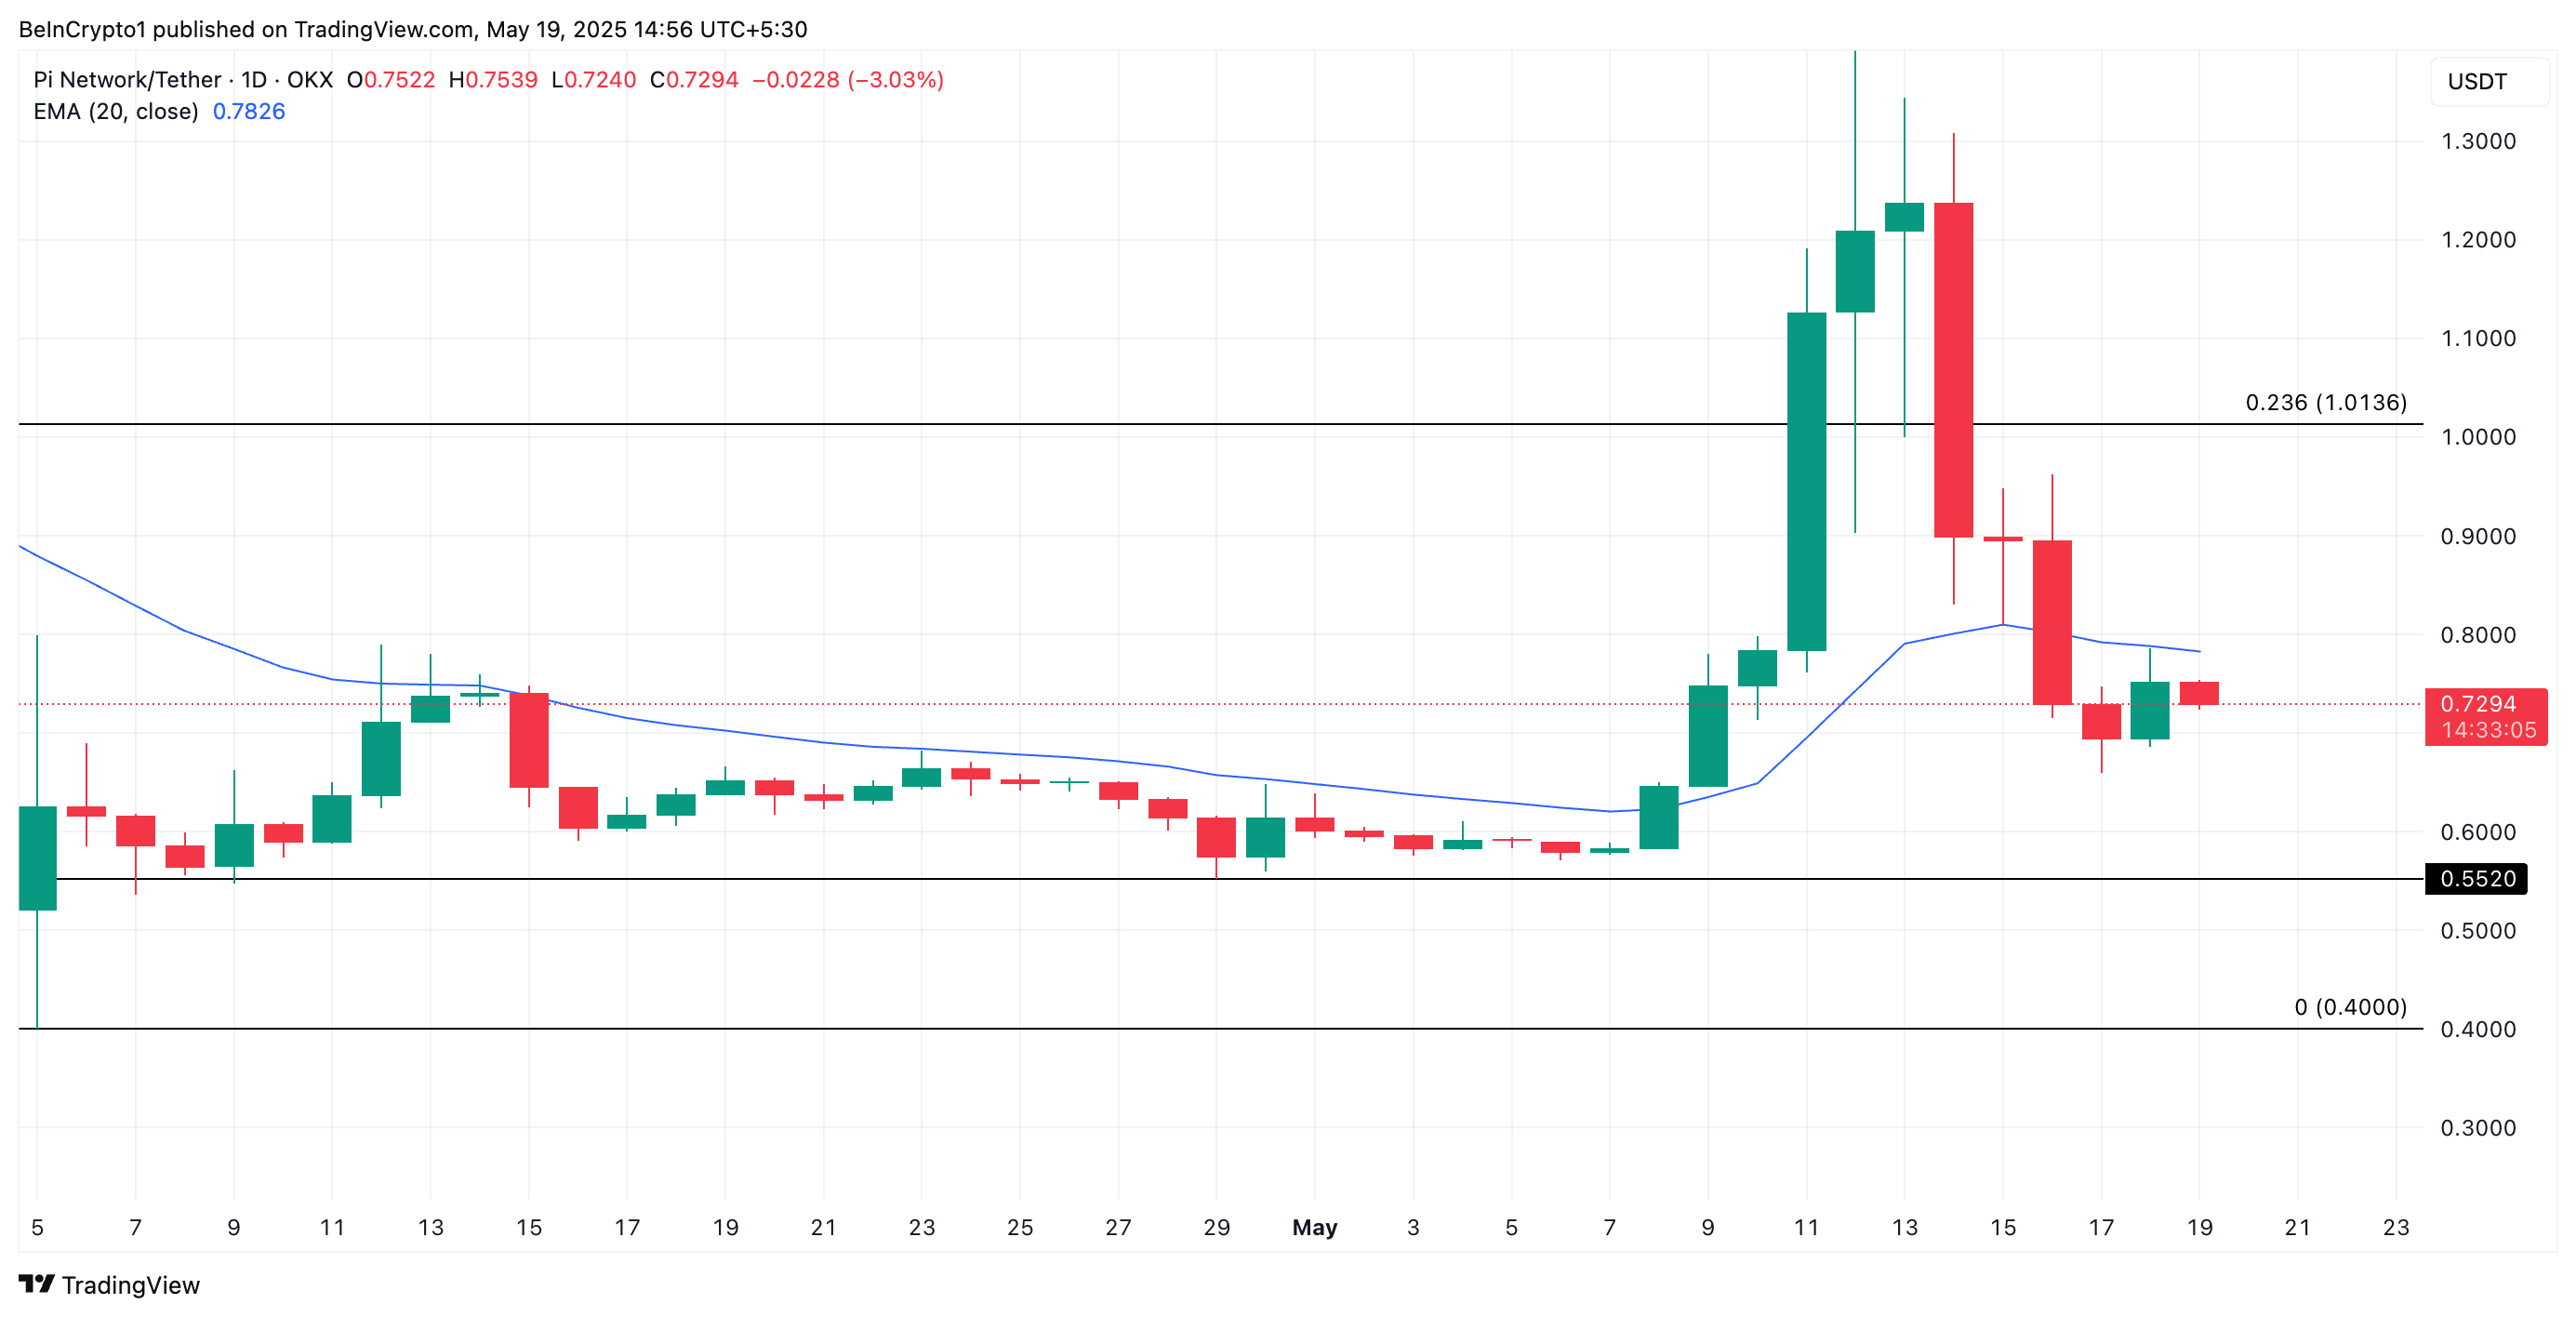
PI has shed half its value over the past seven days, signaling deepening bearish sentiment among its holders. At the time of writing, the altcoin trades at $0.72, marking a steep decline from last week’s price high of $1.67.
Technical indicators suggest that the downtrend may not be over as selling pressure remains significant.
PI Faces Heavy Selling Pressure
PI’s BBTrend remains in the red on the daily chart, confirming that bearish forces are firmly in control. Observed on a one-day chart, the indicator is currently at -19.36.
 PI BBTrend. Source:
TradingView
PI BBTrend. Source:
TradingView
The BBTrend measures the strength and direction of a trend based on the expansion and contraction of Bollinger Bands. When BBTrend values are positive, it signals a strong uptrend, while negative values indicate increasing bearish momentum.
PI’s negative BBTrend suggests that its price consistently closes near the lower Bollinger Band, reflecting sustained selling pressure and hinting at the potential for further downside.
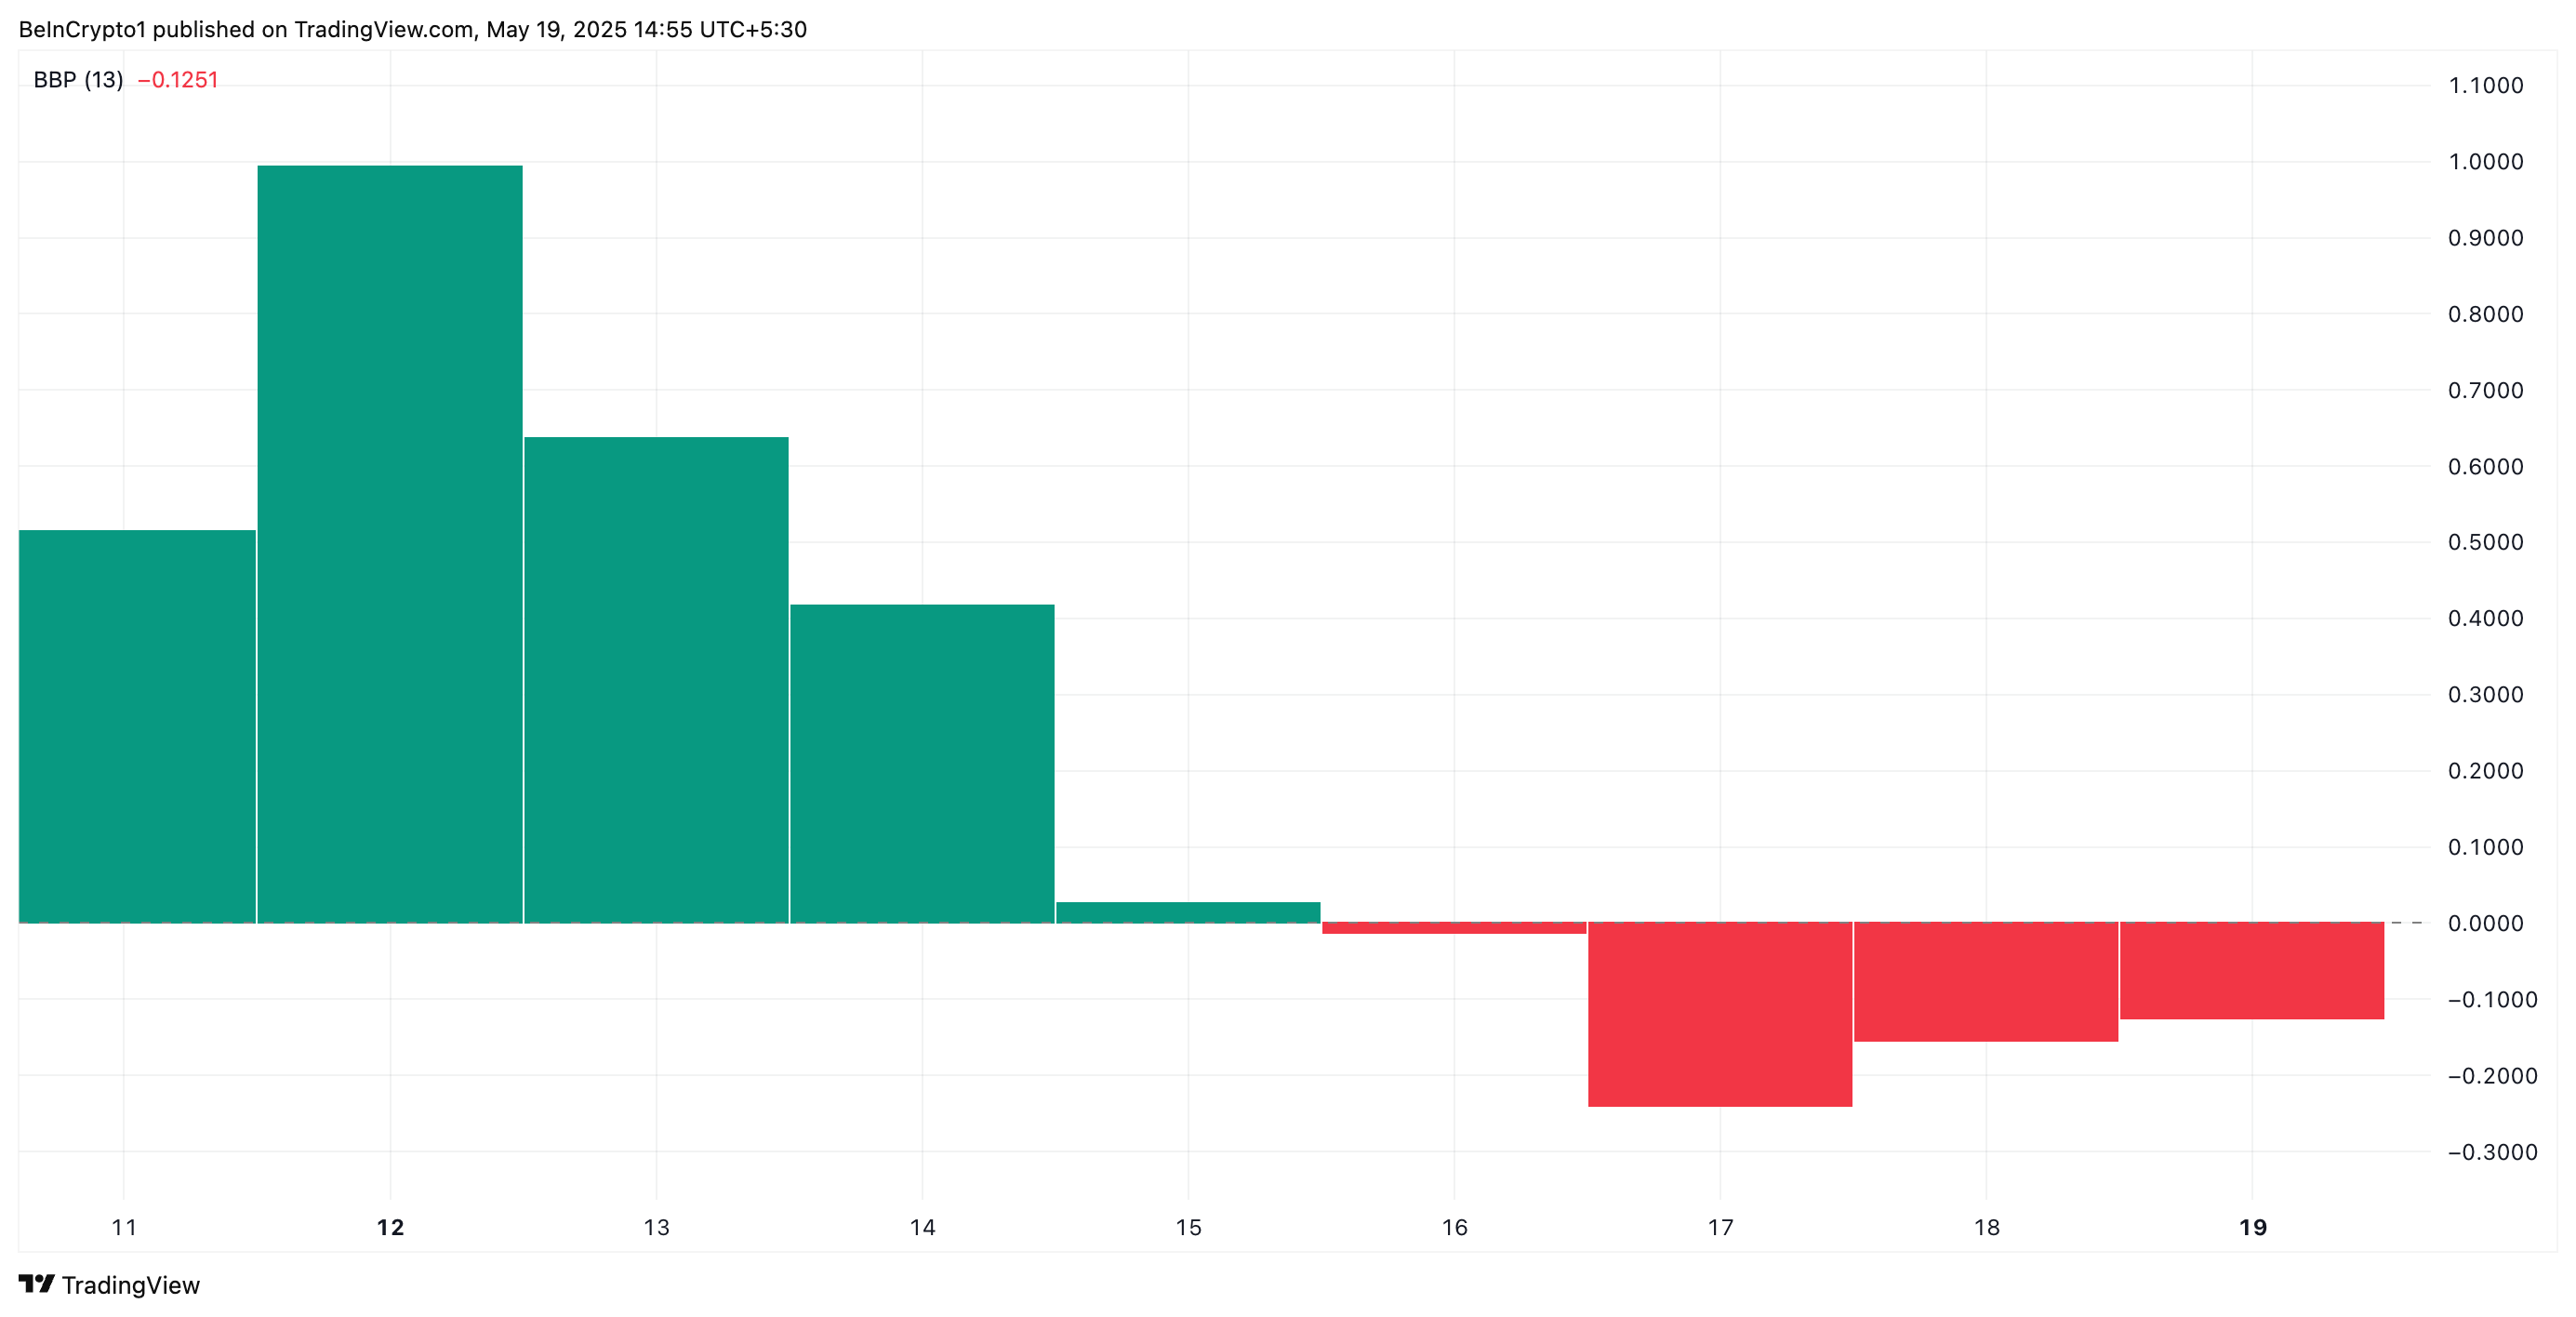
Furthermore, the token’s Elder-Ray Index supports this bearish outlook. At press time, the indicator returns a negative value of -0.12.
 PI Elder-Ray Index. Source:
TradingView
PI Elder-Ray Index. Source:
TradingView
The Elder Ray Index measures the strength of buying and selling pressure in the market, using two key components: Bull Power and Bear Power.
When the index is negative, sellers dominate the market. This signals a bearish trend and hints at a continued downward momentum for PI.
Resistance at 20-Day EMA Caps Recovery Hopes
The PI token trades below its 20-day exponential moving average (EMA), which forms dynamic resistance above it. The 20-day EMA measures an asset’s average price over the past 20 trading days, giving more weight to recent prices.
When an asset trades below its 20-day EMA, recent price action is weaker than the short-term trend. This is a bearish signal indicating a lack of buying momentum.
If the trend continues, PI could fall to $0.55.
 PI Price Analysis. Source:
TradingView
PI Price Analysis. Source:
TradingView
On the other hand, if buying pressure spikes, the PI token could rebound and climb to $1.01.
Disclaimer: The content of this article solely reflects the author's opinion and does not represent the platform in any capacity. This article is not intended to serve as a reference for making investment decisions.
You may also like
After a 1460% Surge: Re-examining the Value Foundation of ZEC
Are ZEC's miner economic model, network security, and on-chain activity truly sufficient to support an FDV of over 10 billions USD?

Glassnode: BTC drops to 89,000, risk aversion remains strong in the options market
In the short term, the $95,000 to $97,000 range may form a local resistance. If the price can reclaim this range, it indicates that the market is gradually returning to balance.

Is the Base co-founder launching a token this time reliable?
How should we view this celebrity token from Base?

Data Insight: Bitcoin's Year-to-Date Gains Turn Negative—Is a Full Bear Market Really Here?
The market has entered a comprehensive defensive phase.