
Celestia’s 3-Month Downtrend Continues as TIA Falls 10% Again – What’s Next?

Celestia faces pressure after failing to break a 3-month downtrend, with cautious investor sentiment and weak momentum. Holding $2.53 support is vital to avoid deeper losses.
Celestia (TIA) has struggled to break out of a three-month-long persistent downtrend, with several unsuccessful attempts to sustain gains above key resistance levels.
This suggests a market lacking strong conviction, with investors hesitant to push the altcoin into a clear upward trajectory.
Celestia Finds Support From Investors
The Chaikin Money Flow (CMF) indicator has shown a modest increase recently but remains just below zero. This implies that while capital inflows are present, overall investor confidence is tentative.
Buyers seem to be attracted by TIA’s relatively low price, yet the momentum isn’t strong enough to decisively break the downtrend.
The CMF’s failure to climb above zero signals lingering caution and suggests that traders are only cautiously entering positions. This tentative interest may result in heightened volatility unless broader market support emerges.
 TIA CMF. Source:
TradingView
TIA CMF. Source:
TradingView
The Relative Strength Index (RSI) spiked briefly into bullish territory but has since retreated below the neutral 50 level. This pattern points to fragile bullish momentum, likely hampered by selling pressure or external market uncertainties.
The drop below 50 reinforces the notion that TIA’s price recovery is precarious. Without renewed buying strength, it faces difficulty overcoming resistance and may continue to languish in subdued trading ranges.
 TIA RSI. Source:
TradingView
TIA RSI. Source:
TradingView
TIA Price Aims To Jump
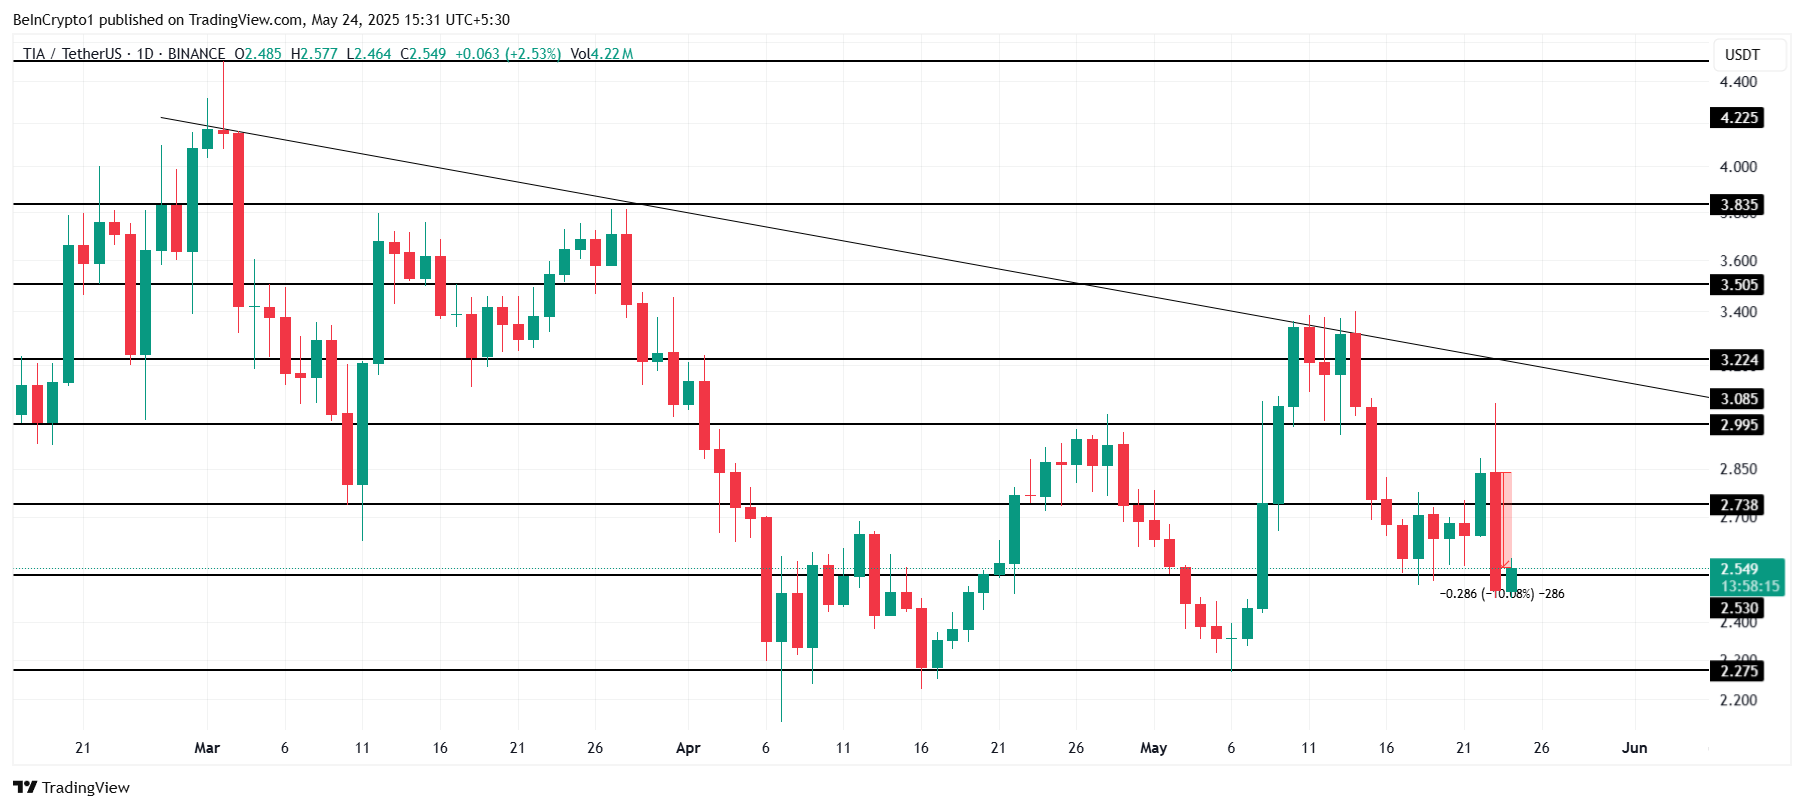
Currently trading around $2.54, TIA is testing a critical support level at $2.53. This level is pivotal for stabilizing price action and preventing further losses, especially after failing to surpass the $3.00 resistance during its prolonged downtrend.
A significant upward breakout appears unlikely for now. However, if support at $2.53 holds, TIA might consolidate, potentially building momentum to retest the $3.00 resistance after breaching $2.73.
 TIA Price Analysis. Source:
TradingView
TIA Price Analysis. Source:
TradingView
Conversely, a decisive break below $2.53 could intensify bearish pressure, pushing the price down toward $2.27. Such a move would invalidate short-term bullish prospects and increase downside risks.
Disclaimer: The content of this article solely reflects the author's opinion and does not represent the platform in any capacity. This article is not intended to serve as a reference for making investment decisions.
You may also like
Has the four-year cycle of Bitcoin failed?
The various anomalies in this cycle—including waning sentiment, weakening returns, disrupted rhythms, and institutional dominance—have indeed led the market to intuitively feel that the familiar four-year cycle is no longer effective.

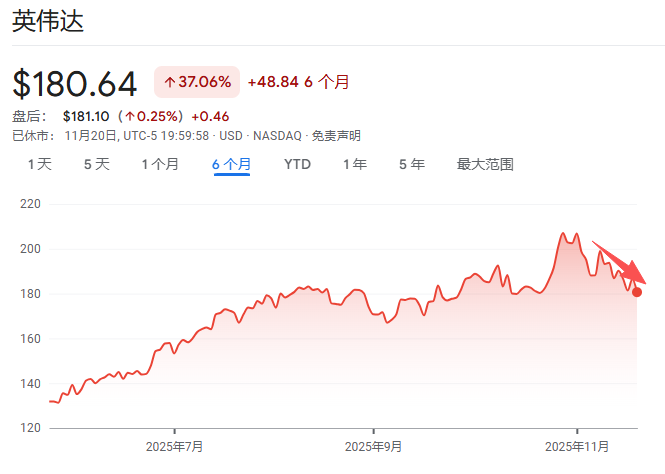
At an internal Nvidia meeting, Jensen Huang admitted: It's too difficult. "If we do well, it's an AI bubble," and "if we fall even slightly short of expectations, the whole world will collapse."
Jensen Huang has rarely admitted that Nvidia is now facing an unsolvable dilemma: if its performance is outstanding, it will be accused of fueling the AI bubble; if its performance disappoints, it will be seen as evidence that the bubble has burst.
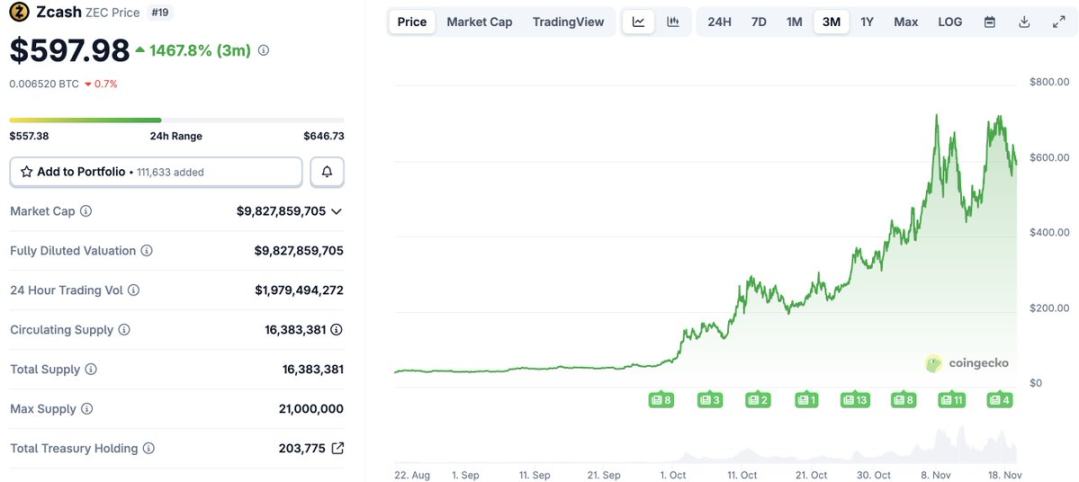
After a 1460% Surge: Reassessing the Value Foundation of ZEC
Narratives and sentiment can create myths, but fundamentals determine how far those myths can go.
The demise of a DAT company
The $1 billion Ethereum DAT plan led by Li Lin and others has been shelved due to the bear market, and funds have been returned. This "going with the flow" approach may reflect consideration of investor sentiment.