
Ethereum's $3000 Breakthrough Battle: $1.8 Billion Short Whale on the Brink

Active addresses in the Ethereum ecosystem surge, but declining transaction fees and staking yields raise concerns.
Original Title: "1.8 Billion Shorts Set for Liquidation! A Bloody Clearing Storm as Ethereum Charges Towards $3000"
Original Author: White55, MarsBit
Prologue: Price Breakouts and Whale Maneuvers
On June 10, 2025, Ethereum's price surged with fierce momentum, breaking past $2,827 to hit a 15-week high. Behind this number lies a brewing storm of liquidations targeting $1.8 billion in short positions. Amid what seems like a random market rally, the calculated movements of a mysterious whale have emerged as the key to deciphering market sentiment.
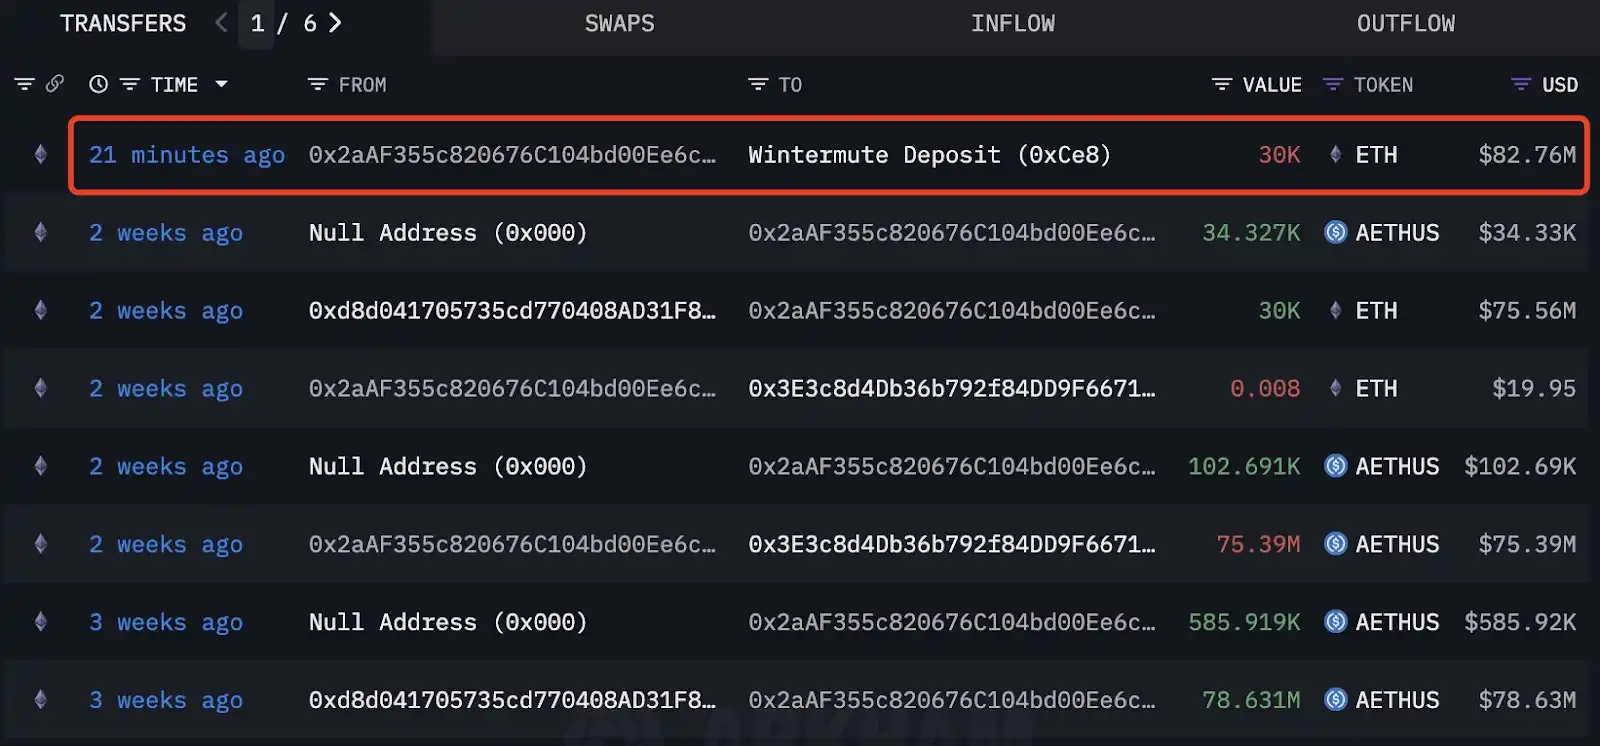
ETH whale trading activity. Data source: Lookonchain/X
According to the on-chain analytics platform Lookonchain, an anonymous address executed two remarkably precise trades over 44 days:
· Round 1 (April 27): Accumulated 30,000 ETH via Wintermute OTC at an average price of $1,830, costing $54.9 million;
· Round 2 (May 27): Sold the same amount of ETH at $2,621, netting a profit of $23.73 million with a stunning 43% return;
· Final Harvest (June 10): Sold another 30,000 ETH via OTC transactions for $82.76 million, securing $7.3 million in profits, summing up to a total profit of $31 million.
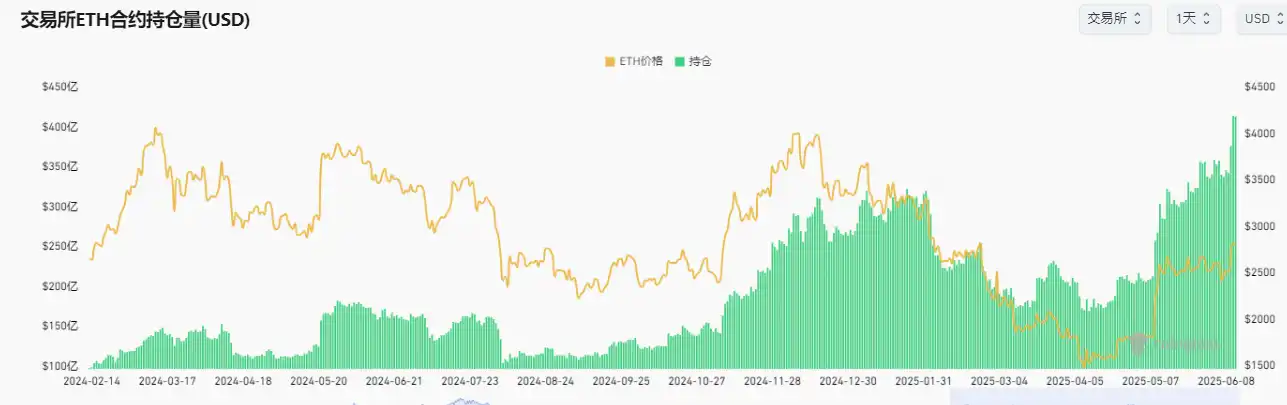
Such maneuvers are not isolated cases. CoinGlass data reveals that Ethereum futures' open interest (OI) has crossed the $40 billion mark for the first time, with the market's leverage ratio approaching a critical threshold. The current liquidity map paints a fragile balance: around $20 billion in long liquidation risk aggregates near the $2,600 mark, while above $2,900 lurks the potential for $1.8 billion worth of short position liquidations. This delicate tug-of-war mirrors the drama of CDO markets in "The Big Short" – any breakout in either direction could trigger a cascading chain reaction.
Chapter 2: Ecosystem Expansion and Value Cracks
Behind the price frenzy, the Ethereum ecosystem is undergoing structural transformation.
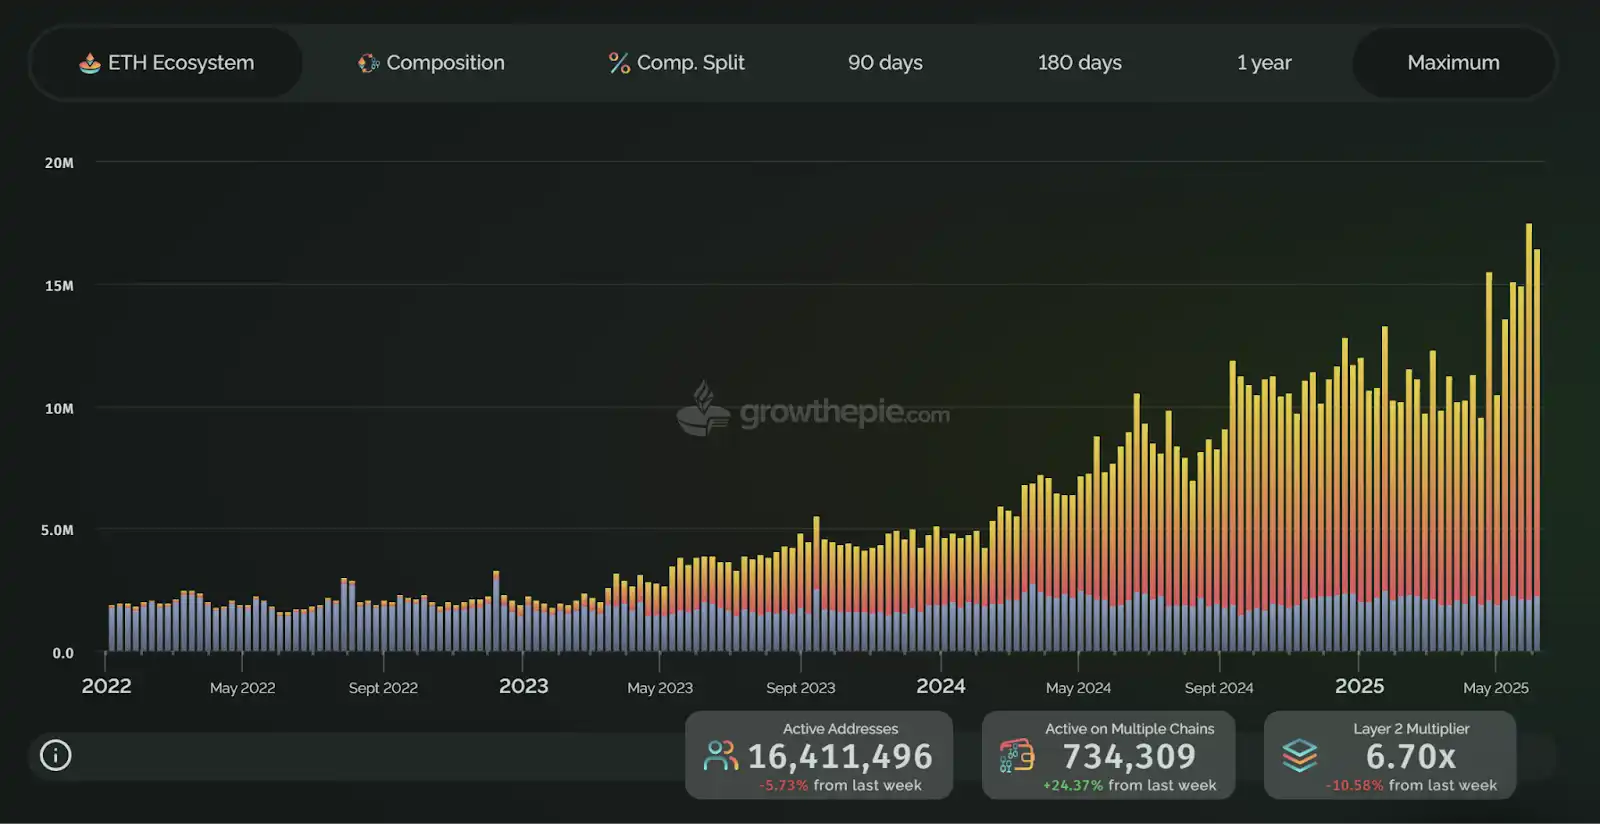
Weekly Ethereum address participation chart. Source: growthepie
Data from growthepie shows a 70% surge in active unique addresses in Q2, reaching a peak of 16.4 million on June 10. Notably, the Base network accounted for 72.81% of this growth (11.29 million addresses), significantly outpacing Ethereum’s mainnet at 14.8% (2.23 million addresses). This "satellite chain feeding the mainnet" model starkly contrasts the "DeFi Summer" narrative of the 2020s.
Despite Ethereum holding a dominant 61% share of the DeFi market with $66 billion TVL, its core revenue model is beginning to show cracks:
· Fee Collapse: Over the past 30 days, network fees have plummeted to just $43.3 million, a 90% drop compared to pre-Cancun levels;
· Staking Yield Dilemma: While Blob technology reduces Layer 2 costs, staking yields have stagnated at an annualized 3.12%, lagging significantly behind competitors like Solana;
· Regulatory Constraints: SEC scrutiny of ETH staking has led to $369 million in net outflows from spot ETFs over eight consecutive days, shaking institutional confidence.
These tensions are reflected in on-chain data from Glassnode: the share of "diamond hands" holding ETH for over a year has dropped sharply from 63% to 55%, while short-term holders' selloffs have surged by 47%. When technological upgrades fail to translate into holder returns, ecosystem prosperity paradoxically becomes a driver of value dilution.
Chapter 3: The Crimson Compass of the Derivatives Market
The futures market is teeming with undercurrents, as ETH futures open interest (OI) surpasses $40 billion for the first time in history, indicating elevated leverage levels. Such a spike in open interest suggests potentially heightened volatility ahead.
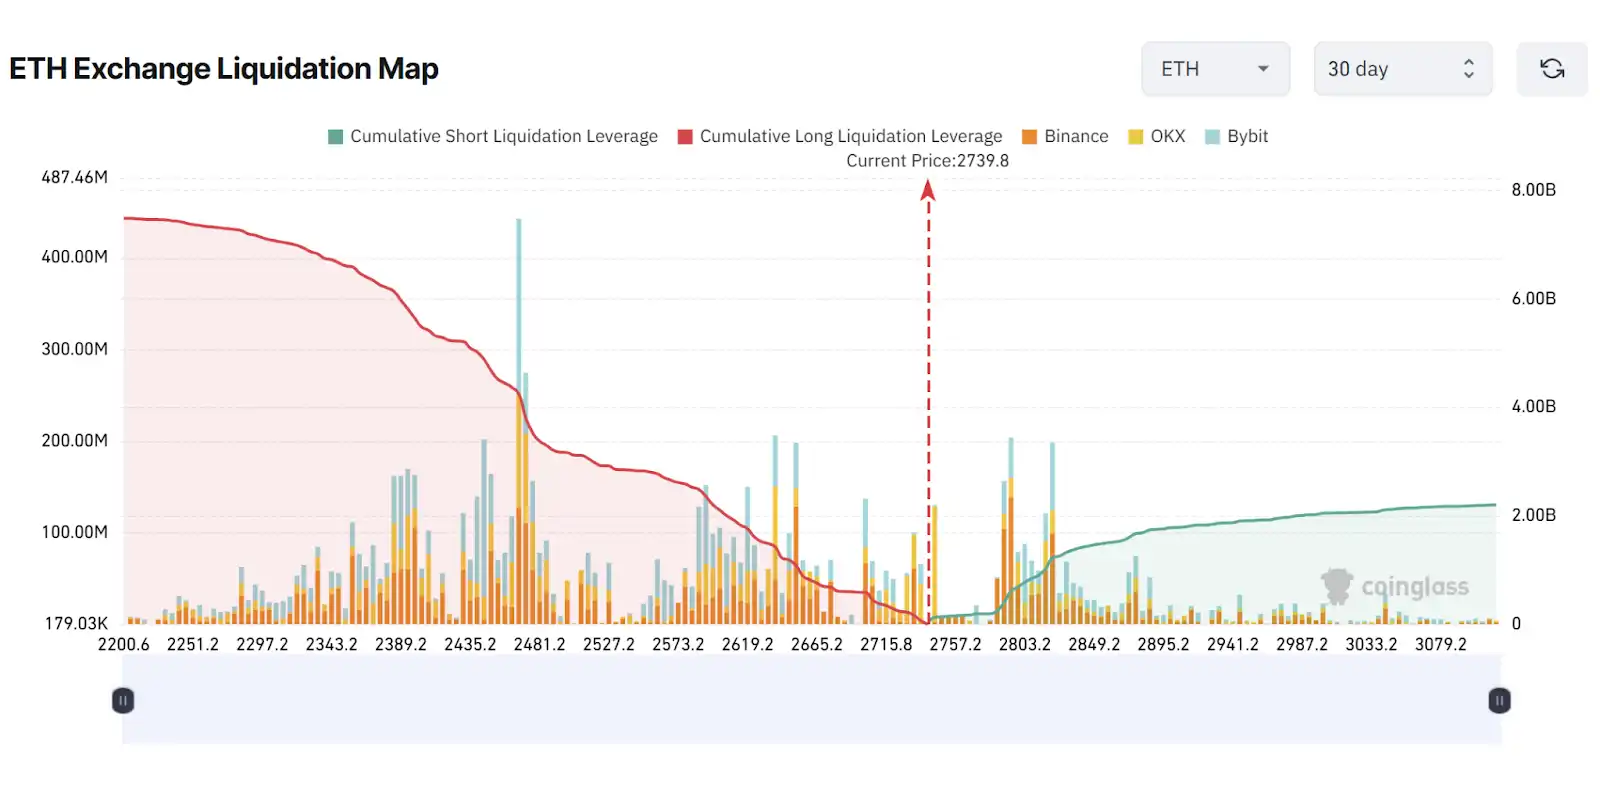
Ethereum liquidation chart. Source: CoinGlass
The liquidation heatmap from CoinGlass lays bare the ruthless logic of capital games:
· Bull Trap Zone: The $2,600-$2,665 range stacks up $2 billion in liquidation risk, coinciding with the 50% Fibonacci retracement level of the 2024 bull market;
· Bear Graveyard: $2,900 resistance threatens $1.8 billion in short positions, aligning with the historical ETH/BTC ratio low of 0.019;
· Institutional Duality: CME Ethereum futures hold an open interest share of 9%, significantly contrastive to Bitcoin futures' 24%, signaling traditional capital remains in a wait-and-see stance.
The distorted prosperity in the derivatives market is, in essence, a manifestation of a liquidity trap. When perpetual funding rates remain negative and taker’s buy-sell ratio falls below 1, the market has entered a state of "extreme bearishness." In such an atmosphere, whales cashing out via OTC deals resemble signals of an exit just before the party ends—history shows a 68% probability of a black swan event within 3 months following record-high open interest levels.
Chapter 4: Technical Code and Macro Variables
Analyzing from candlestick patterns, the current trend holds hidden clues:
· Volatility Squeeze: The daily Bollinger Bands have tightened to 5%, the lowest since February 2024, indicating an imminent breakout can be expected;
· Weekly Paradox: Price has stabilized above the 50-week and 100-week EMAs, but the MACD histogram shows a bearish divergence. The RSI value at 42 suggests limited further upside potential;
· Fibonacci Barrier: A daily close above $2,800 will mark the pivotal line, with a potential breakout opening up the theoretical range of $3,200-$3,500. Failing to hold may see a retest of $2,500 as key support.
On the macro front, U.S.-Russia geopolitical negotiations and the anticipated Fed rate cuts stand as dual disruptors. CME interest rate futures indicate markets are pricing in 2-3 rate cuts by 2025, with a probability of 79%. Should the actual trajectory deviate, the crypto market will bear the brunt. Meanwhile, Standard Chartered Bank warns that Ethereum may face a market cap wipeout of $100 billion if the RWA (Real World Assets) narrative fails to materialize by Q3.
Final Chapter: On the Eve of a Paradigm Shift
Ethereum stands at a historical crossroads:
· Staking Economy Overhaul: Through EIP-7251, the validator staking cap is proposed to be raised to 2048 ETH, alongside enhanced exit mechanisms to alleviate liquidity concerns;
· Layer2 Value Feedback: Mandating Layer2 solutions such as Arbitrum to allocate a portion of transaction fee revenues back to the mainnet, addressing the paradox of "ecosystem thriving while the mainnet suffers liquidity issues";
· Regulatory Breakthrough: If the SEC approves 21Shares Staking ETF in Q3, it is expected to drive a short-term price surge of 15-20% and lock in 8% of the circulating supply.
As Peter Brandt mentioned, after breaking through the $2,800 congestion zone, Ethereum could potentially embark on a "moonshot" rally to $5,232. However, caution is advised as the essence of this capital play remains a liquidity hunt driven by leverage. When $1.8 billion worth of short positions transforms into fuel, the market will ultimately confirm: who is steering the trend, and who is swimming naked.
Disclaimer: The content of this article solely reflects the author's opinion and does not represent the platform in any capacity. This article is not intended to serve as a reference for making investment decisions.
You may also like
Bitget donates HK$12 million to support fire rescue and reconstruction efforts in Tai Po, Hong Kong
Bitget Spot Margin Announcement on Suspension of ELX/USDT Margin Trading Services
Enjoy perks for new grid traders and receive dual rewards totaling 150 USDT
Bitget Spot Margin Announcement on Suspension of BEAM/USDT, ZEREBRO/USDT, AVAIL/USDT, HIPPO/USDT, ORBS/USDT Margin Trading Services