Dogecoin Breaks $0.20: Is a 30% Rally Coming Next?

Dogecoin (DOGE) price has just crossed a critical psychological level of $0.20, and both the hourly and daily charts suggest this move might not be a fluke. The Dogecoin price appears to be breaking out from a consolidation phase , potentially setting itself up for a strong move toward the $0.26–$0.28 range in the coming days. Let’s dig into the charts to understand why this breakout could be just the beginning.
Dogecoin Price Prediction: What Does the Hourly Chart Reveal?
 DOGE/USD 1 Hr Chart- TradingView
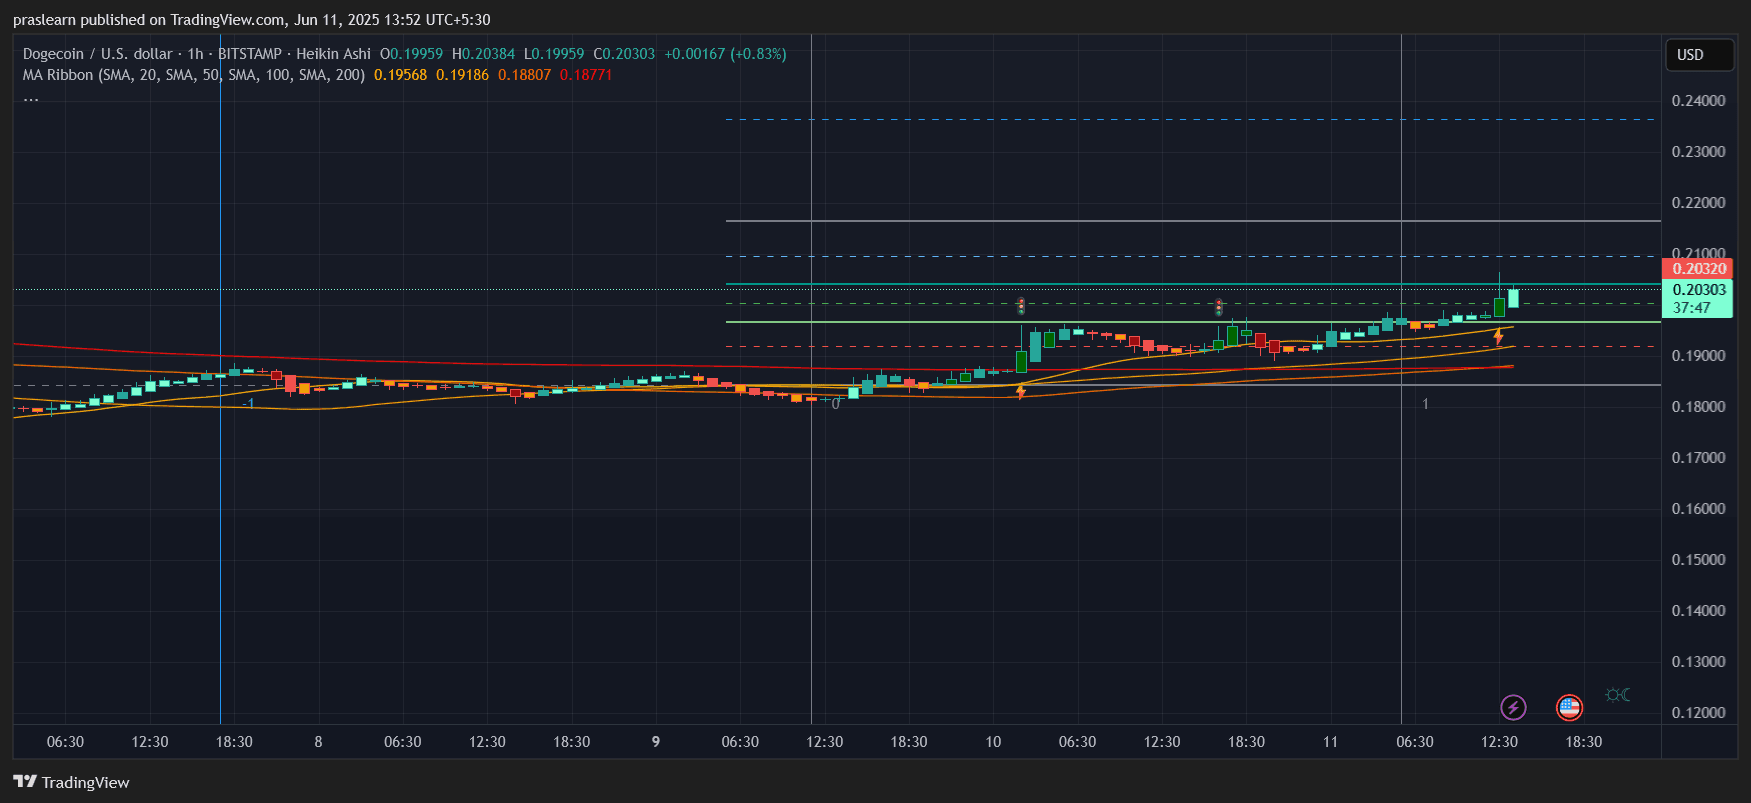
The 1-hour Heikin Ashi chart shows that DOGE price recently broke through local resistance at $0.20 with rising momentum. This level had acted as a ceiling for several days, and the breakout was supported by higher lows, forming an ascending triangle—one of the most bullish intraday setups.
The Moving Average (MA) Ribbon (20, 50, 100, 200 SMA) is now stacked in bullish order with the 20 SMA at $0.195 and the 200 SMA trailing lower at $0.187. This alignment confirms a near-term uptrend. The price is currently hovering around $0.203 with low selling pressure and strong Heikin Ashi green candles, hinting that bulls are firmly in control.
Also, Fibonacci retracement levels from the recent swing high around $0.21 to swing low near $0.18 show that DOGE has reclaimed the 0.618 golden zone and is now testing the 0.786 level, commonly a launchpad for accelerated moves.
If this breakout sustains, the next resistance lies for Dogecoin price around $0.21. A clean break above that could trigger a quick surge toward $0.23 and even $0.26.
📊 Buy DOGE on Bitget
Daily Chart Analysis: Bigger Picture Turning Bullish?
 DOGE/USD 1 Day Chart- TradingView
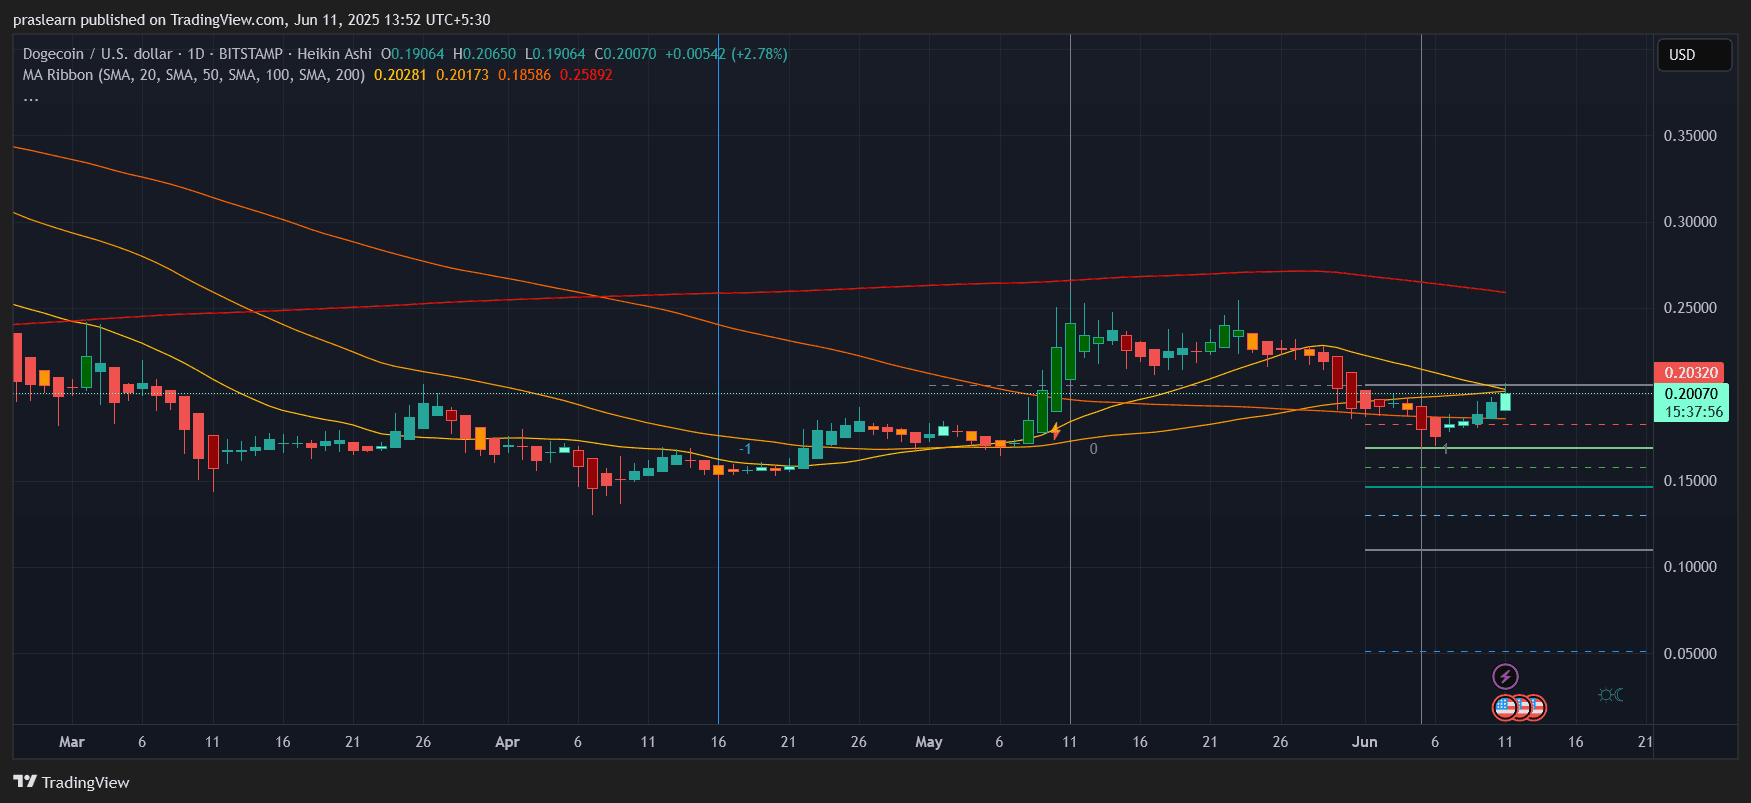
The daily chart supports the bullish short-term momentum. DOGE price is up +2.78% today and reclaiming the 50-day SMA, which is currently around $0.2017. This is significant because the 50-day SMA has acted as dynamic resistance throughout the last few weeks.
Moreover, the Dogecoin price is forming a short-term double bottom with support near $0.16, and the neckline at $0.203 is being tested now. If DOGE manages to close a daily candle above this neckline, the classic double-bottom pattern targets approximately $0.25. The measured move is calculated as:
Target = Neckline + (Neckline – Bottom)
Target = $0.203 + ($0.203 – $0.16) = $0.203 + $0.043 = $0.246
That’s about a 22.5% upside from current levels.
Adding fuel to the fire, the 20-day SMA has turned up and crossed above the 100 SMA—a medium-term bullish crossover. The 200 SMA still sits higher at $0.2589, and that could act as the final upside target if momentum persists.
Dogecoin Price Prediction: Can DOGE Price Hit $0.26 in June?
Based on the hourly bullish structure and daily breakout confirmation, DOGE price looks poised to target $0.25–$0.26 over the next 7–10 days , provided Bitcoin holds above key support and market sentiment remains positive.
Assuming the breakout holds and volume increases, the following path looks realistic:
- Minor resistance at $0.21
- Bullish breakout to $0.23 (short-term Fibonacci extension)
- Final upside target $0.25–$0.26 (double bottom target + 200-day SMA)
From the current price of $0.203, a move to $0.26 would represent a 28% gain.
📊 Buy DOGE on Bitget
Final Take
Dogecoin price is showing strong bullish signals both on lower timeframes and the daily chart. The reclaim of $0.20 is not just a number—it breaks a psychological barrier, confirms a reversal structure, and brings in new technical buyers. With momentum building and key moving averages flipping, DOGE could be gearing up for a multi-week rally.
But as always, watch for a confirmed daily close above $0.21 and keep an eye on Bitcoin. If the broader market remains steady, Dogecoin may just surprise again—this time with a 30% run.
$DOGE, $Dogecoin
Dogecoin (DOGE) price has just crossed a critical psychological level of $0.20, and both the hourly and daily charts suggest this move might not be a fluke. The Dogecoin price appears to be breaking out from a consolidation phase , potentially setting itself up for a strong move toward the $0.26–$0.28 range in the coming days. Let’s dig into the charts to understand why this breakout could be just the beginning.
Dogecoin Price Prediction: What Does the Hourly Chart Reveal?
DOGE/USD 1 Hr Chart- TradingView
The 1-hour Heikin Ashi chart shows that DOGE price recently broke through local resistance at $0.20 with rising momentum. This level had acted as a ceiling for several days, and the breakout was supported by higher lows, forming an ascending triangle—one of the most bullish intraday setups.
The Moving Average (MA) Ribbon (20, 50, 100, 200 SMA) is now stacked in bullish order with the 20 SMA at $0.195 and the 200 SMA trailing lower at $0.187. This alignment confirms a near-term uptrend. The price is currently hovering around $0.203 with low selling pressure and strong Heikin Ashi green candles, hinting that bulls are firmly in control.
Also, Fibonacci retracement levels from the recent swing high around $0.21 to swing low near $0.18 show that DOGE has reclaimed the 0.618 golden zone and is now testing the 0.786 level, commonly a launchpad for accelerated moves.
If this breakout sustains, the next resistance lies for Dogecoin price around $0.21. A clean break above that could trigger a quick surge toward $0.23 and even $0.26.
📊 Buy DOGE on Bitget
Daily Chart Analysis: Bigger Picture Turning Bullish?
DOGE/USD 1 Day Chart- TradingView
The daily chart supports the bullish short-term momentum. DOGE price is up +2.78% today and reclaiming the 50-day SMA, which is currently around $0.2017. This is significant because the 50-day SMA has acted as dynamic resistance throughout the last few weeks.
Moreover, the Dogecoin price is forming a short-term double bottom with support near $0.16, and the neckline at $0.203 is being tested now. If DOGE manages to close a daily candle above this neckline, the classic double-bottom pattern targets approximately $0.25. The measured move is calculated as:
Target = Neckline + (Neckline – Bottom)
Target = $0.203 + ($0.203 – $0.16) = $0.203 + $0.043 = $0.246
That’s about a 22.5% upside from current levels.
Adding fuel to the fire, the 20-day SMA has turned up and crossed above the 100 SMA—a medium-term bullish crossover. The 200 SMA still sits higher at $0.2589, and that could act as the final upside target if momentum persists.
Dogecoin Price Prediction: Can DOGE Price Hit $0.26 in June?
Based on the hourly bullish structure and daily breakout confirmation, DOGE price looks poised to target $0.25–$0.26 over the next 7–10 days , provided Bitcoin holds above key support and market sentiment remains positive.
Assuming the breakout holds and volume increases, the following path looks realistic:
- Minor resistance at $0.21
- Bullish breakout to $0.23 (short-term Fibonacci extension)
- Final upside target $0.25–$0.26 (double bottom target + 200-day SMA)
From the current price of $0.203, a move to $0.26 would represent a 28% gain.
📊 Buy DOGE on Bitget
Final Take
Dogecoin price is showing strong bullish signals both on lower timeframes and the daily chart. The reclaim of $0.20 is not just a number—it breaks a psychological barrier, confirms a reversal structure, and brings in new technical buyers. With momentum building and key moving averages flipping, DOGE could be gearing up for a multi-week rally.
But as always, watch for a confirmed daily close above $0.21 and keep an eye on Bitcoin. If the broader market remains steady, Dogecoin may just surprise again—this time with a 30% run.
$DOGE, $Dogecoin
Disclaimer: The content of this article solely reflects the author's opinion and does not represent the platform in any capacity. This article is not intended to serve as a reference for making investment decisions.
You may also like
$8.8 billion outflow countdown: MSTR is becoming the abandoned child of global index funds
The final result will be revealed on January 15, 2026, and the market has already started to vote with its feet.
Deconstructing DAT: Beyond mNAV, How to Identify "Real vs. Fake HODLing"?
There is only one iron rule for investing in DAT: ignore premium bubbles and only invest in those with a genuine flywheel of continuously increasing "crypto per share."

Empowered by AI Avatars, How Does TwinX Create Immersive Interaction and a Value Closed Loop?
1. **Challenges in the Creator Economy**: Web2 content platforms suffer from issues such as opaque algorithms, non-transparent distribution, unclear commission rates, and high costs for fan migration, making it difficult for creators to control their own data and earnings. 2. **Integration of AI and Web3**: The development of AI technology, especially AI Avatar technology, combined with Web3's exploration of the creator economy, offers new solutions aimed at breaking the control of centralized platforms and reconstructing content production and value distribution. 3. **Positioning of the TwinX Platform**: TwinX is an AI-driven Web3 short video social platform that aims to reconstruct content, interaction, and value distribution through AI avatars, immersive interactions, and a decentralized value system, enabling creators to own their data and income. 4. **Core Features of TwinX**: These include AI avatar technology, which allows creators to generate a learnable, configurable, and sustainably operable "second persona", as well as a closed-loop commercialization pathway that integrates content creation, interaction, and monetization. 5. **Web3 Characteristics**: TwinX embodies the assetization and co-governance features of Web3. It utilizes blockchain to confirm and record interactive behaviors, turning user activities into traceable assets, and enables participants to engage in platform governance through tokens, thus integrating the creator economy with community governance.

Aster CEO explains in detail the vision of Aster privacy L1 chain, reshaping the decentralized trading experience
Aster is set to launch a privacy-focused Layer 1 (L1) public chain, along with detailed plans for token empowerment, global market expansion, and liquidity strategies.