

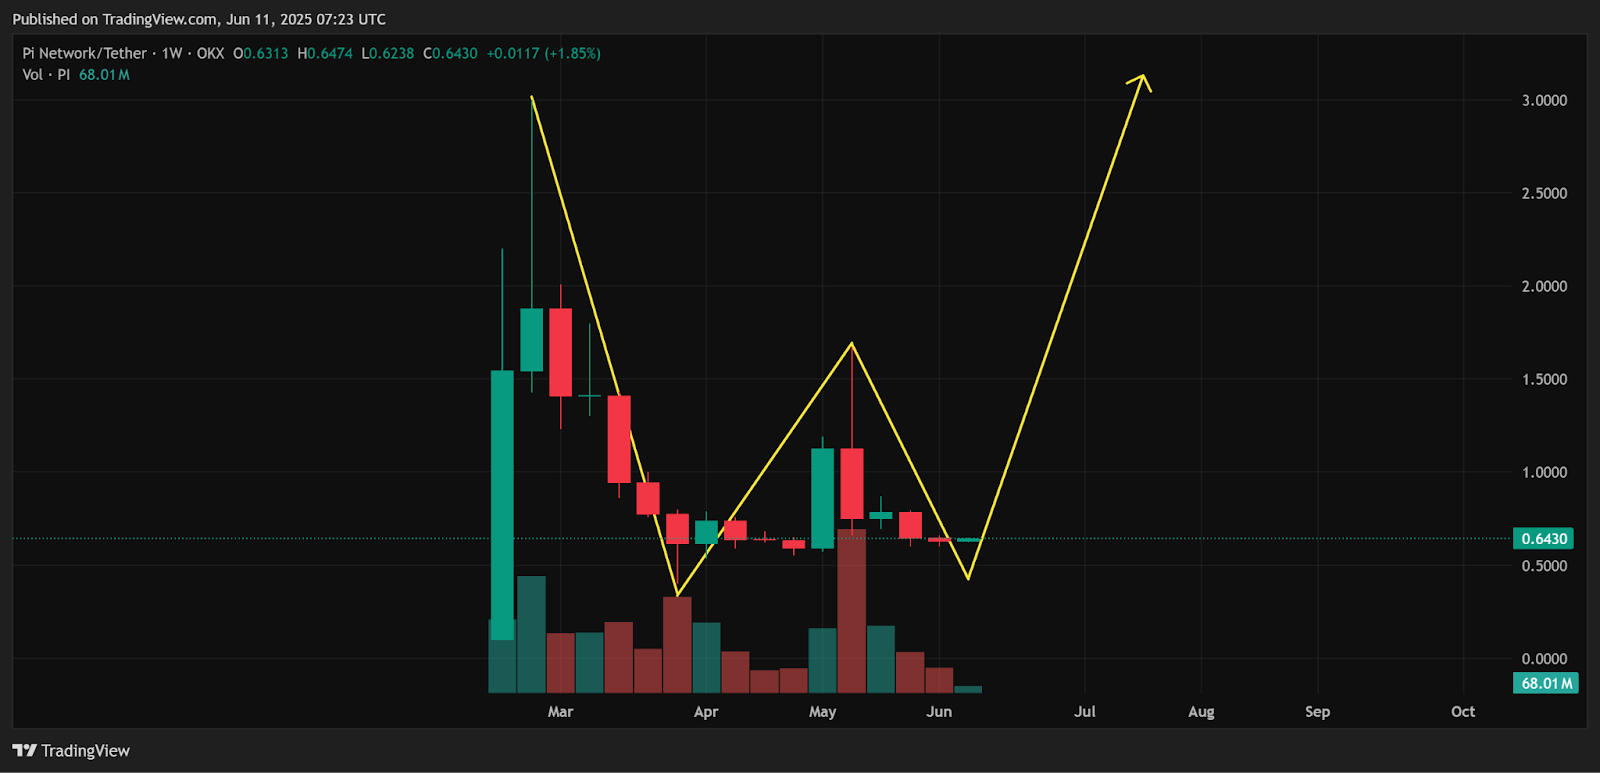
- Double-bottom pattern on the weekly chart suggests a potential reversal toward $1.67 and beyond.
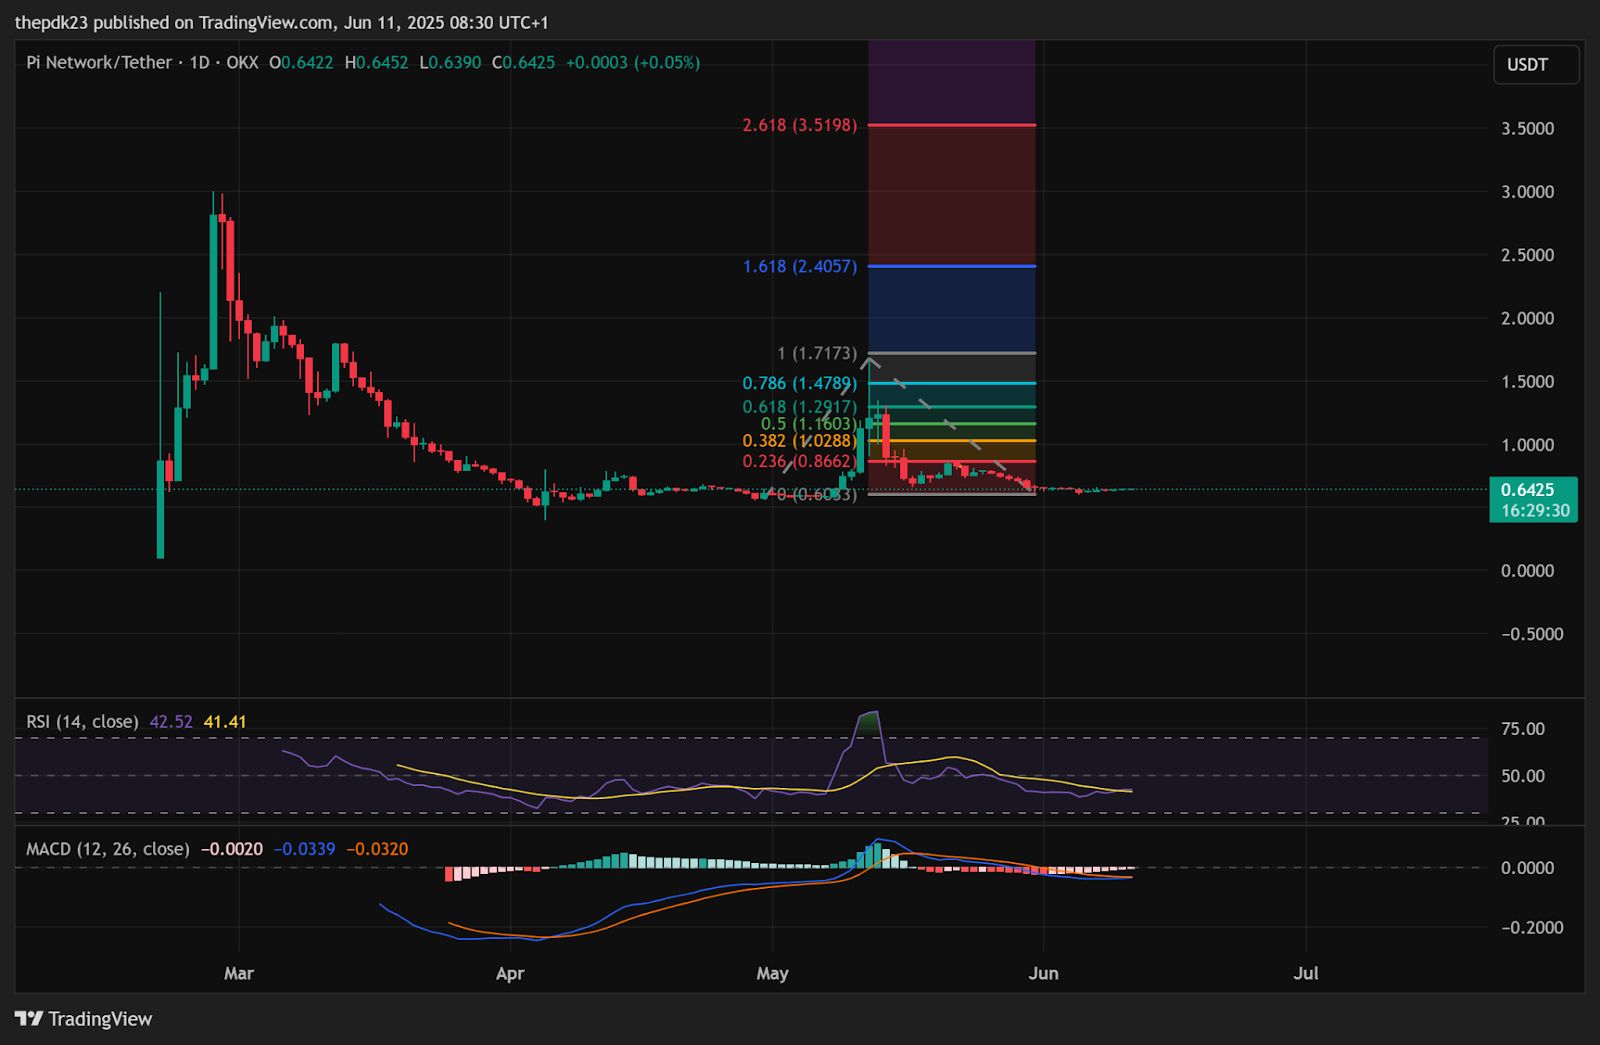
- RSI and MACD on the daily chart show early signs of bullish momentum building.
- Pi Day 2 event and rising social dominance may act as catalysts for a possible short squeeze.
The Pi Network’s token (PI), a controversial yet massively popular digital asset, appears to be forming a classic bullish “double-bottom” pattern on its weekly chart, a technical setup that is now putting traders on high alert for a potential short squeeze.
With the current price hovering near $0.64, as per CoinMarketCap data , traders are eyeing a possible short squeeze, especially as social and technical signals align.
A Bullish Blueprint: The “Double Bottom” on the Weekly Chart
The weekly chart of PI/USDT shows a distinct double-bottom formation anchored by support around $0.5850 and a neckline near $1.6708. This pattern is widely regarded as a reversal indicator, particularly when accompanied by falling volume and volatility, both of which are present in the current structure.
 Source: TradingView
A confirmed break above the $1.00 psychological resistance could trigger a run toward the neckline at $1.6708, a 160% rally from current levels. Beyond that, the Fibonacci extension levels hint at an ambitious target zone around $2.40 (1.618) and possibly $3.50 (2.618) if momentum snowballs.
However, failure to hold above $0.5497, the most recent local low, would invalidate the bullish setup and potentially open the gates for a retest of the all-time low near $0.40.
Related: Pi Coin Sees 22% Volume Spike as Price Finds Strong Technical Support Near $0.62
Daily Indicators Show Momentum Is Building
The daily chart adds depth to this bullish thesis but also underscores the need for caution. The Relative Strength Index (RSI) is currently at 42, indicating neutral momentum, neither overbought nor oversold. This suggests that PI is consolidating and may be preparing for its next directional move.
The MACD is showing early signs of a bullish crossover. The histogram is flattening, and the MACD line is closing in on the signal line from below. Should this crossover complete in the coming days, it would support the bullish breakout narrative.
 Source: TradingView
The Fibonacci retracement levels, measured from the swing high to the swing low, offer potential resistance points. Key retracement levels include:
- 0.382 ($1.0288)
- 0.5 ($1.1603)
- 0.618 ($1.2917)
- 0.786 ($1.4789)
These could act as profit-taking zones or resistance levels during an uptrend, with the $1.00 mark aligning with the 0.382 level.
What Could Trigger a Short Squeeze for Pi?
There’s growing chatter about a potential exchange listing, which could act as the trigger for a short squeeze. Historical examples include ORCA soaring 200% post-Upbit listing, while Axelar, Ravencoin, and Pocket Network also saw massive spikes after similar events. If PI gets listed on a major exchange like Binance, Coinbase, or Upbit, it could mimic these explosive moves.
Further fueling this narrative is rising social dominance, now at 0.276%, according to Santiment , its highest since May 21. Social sentiment often precedes price action, especially in highly speculative assets.
Related: Bitcoin’s Supply Squeeze: What Happens When the Entire BTC Supply Disappears From Exchanges?
Also on the radar is the upcoming Pi Day 2 event on June 28, which marks the end of the .pi domain auction and the closing of the Open Network PiFest. This could provide the fundamental catalyst needed to push PI above resistance levels and validate the bullish double-bottom pattern.
Disclaimer: The information presented in this article is for informational and educational purposes only. The article does not constitute financial advice or advice of any kind. Coin Edition is not responsible for any losses incurred as a result of the utilization of content, products, or services mentioned. Readers are advised to exercise caution before taking any action related to the company.