

Date: Thu, June 12, 2025 | 06:30 AM GMT
The cryptocurrency market is showing signs of a pullback following yesterday’s rally triggered by the U.S. CPI data release. Bitcoin (BTC) dropped from its 24-hour high of $110,384 to around $107,776 at the time of writing, applying downward pressure on major memecoins— including Pepe (PEPE).
PEPE is currently down by over 3%, but a closer analysis of the chart reveals that the asset may be gearing up for a potential bounceback.
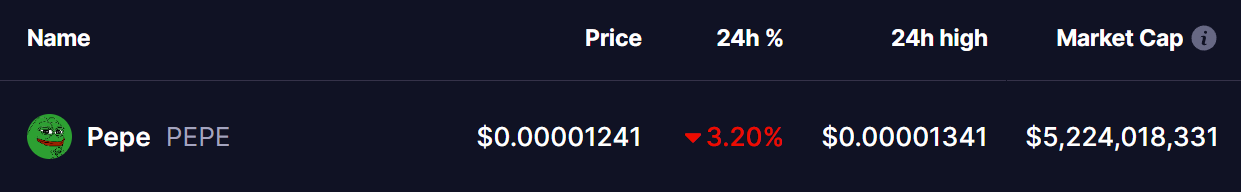 Source: Coinmarketcap
Patterns Signaling Potential Bounce Back
PEPE’s 4-hour chart presents a compelling technical case. The price has completed a Bearish Cypher harmonic pattern, which typically signals a possible short-term correction followed by a continuation of the larger trend.
Additionally, PEPE recently broke out of a falling wedge, a bullish reversal pattern. It’s now retesting the wedge’s upper trendline — a healthy technical move that often precedes a fresh upward push.
 PEPE 4H Chart/Coinsprobe (Source: Tradingview)
The D-point of the harmonic pattern hit near $0.00001360, and since then, price action has been cooling off. As of now, PEPE is hovering around the 0.382 Fibonacci retracement level at $0.00001243, which has already been tested.
What’s Next for PEPE?
The combination of a falling wedge breakout retest and resilience at the 0.382 Fibonacci retracement level ($0.00001243) suggests that PEPE could be gearing up for a bounce.
If the current support holds, PEPE may resume its upward momentum, with potential upside targets at $0.00001400 and $0.00001632 — the latter representing nearly a 30% gain from the current price level.
However, a break below the 0.382 level could expose PEPE to a deeper pullback toward the 0.618 Fibonacci support near $0.00001166. Traders should keep a close eye on this key zone as a failure to hold could shift short-term momentum back in favor of the bears.
Disclaimer: This article is for informational purposes only and not financial advice. Always conduct your own research before investing in cryptocurrencies.