

Date: Thu, June 12, 2025 | 09:34 AM GMT
The cryptocurrency market is showing signs of a pullback following yesterday’s rally triggered by the U.S. CPI data release. Ethereum (ETH) dropped from its 24-hour high of $2,877 to around $2,750 at the time of writing, applying downward pressure on major memecoins — including Fartcoin (FARTCOIN).
FARTCOIN is currently trading in red, retracing from its 24-hour high of $1.50 to the current price of $1.33. A closer look at the chart reveals a potentially bearish setup that could be signaling a short-term correction is underway.
 Source: Coinmarketcap
Bearish Shark Pattern in Play
FARTCOIN’s 4-hour chart shows a Bearish Shark harmonic pattern — a setup that typically forecasts a short-term reversal. The C-point of this pattern was completed near the $1.50 level, aligning closely with the 0.88 Fibonacci retracement of the O to X leg. This area is commonly referred to as the Potential Reversal Zone (PRZ), where price often reacts and reverses.
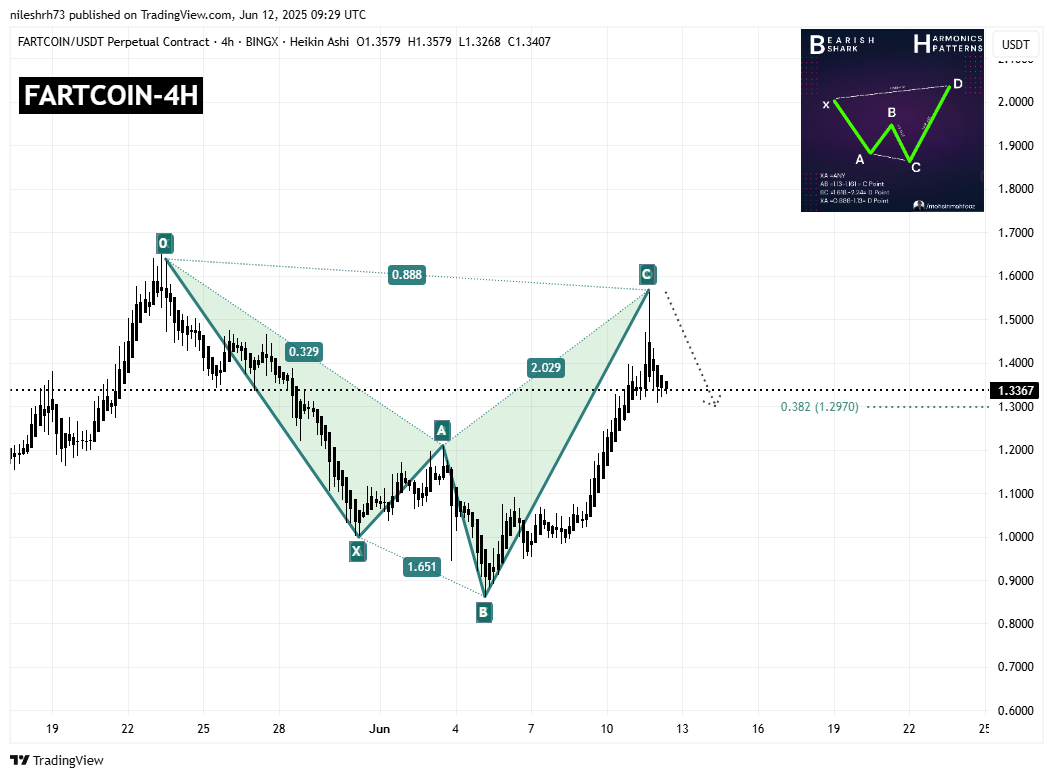 FARTCOIN 4H Chart/Coinsprobe (Source: Tradingview)
Since touching that zone, FARTCOIN has pulled back to $1.33, suggesting that the harmonic pattern may already be in motion.
If the pattern continues to play out as expected, the price could dip toward the $1.29 region, which marks the 38.2% Fibonacci retracement level of the C to D leg. This support zone is often a place where price stabilizes or stages a short-term bounce.
What’s Next for FARTCOIN?
If FARTCOIN finds support around the $1.29 level and buyers return, the bullish momentum may reset, allowing the asset to climb back toward previous highs or even challenge the $1.50 resistance again.
Disclaimer: This article is for informational purposes only and not financial advice. Always conduct your own research before investing in cryptocurrencies.