
Is Litecoin Price Ready to Skyrocket?

Litecoin (LTC) price has been quietly consolidating beneath key moving averages, and the charts suggest a major move is coming. As of June 16, 2025, LTC price is trading around $86.64 , showing slight strength, but traders are still hesitant as the coin battles resistance from above. Let’s dive into the daily and hourly charts to understand what’s next and calculate the breakout potential.
Litecoin Price Prediction: Is LTC Price Preparing for a Reversal?
 LTC/USD 1 Day Chart- TradingView
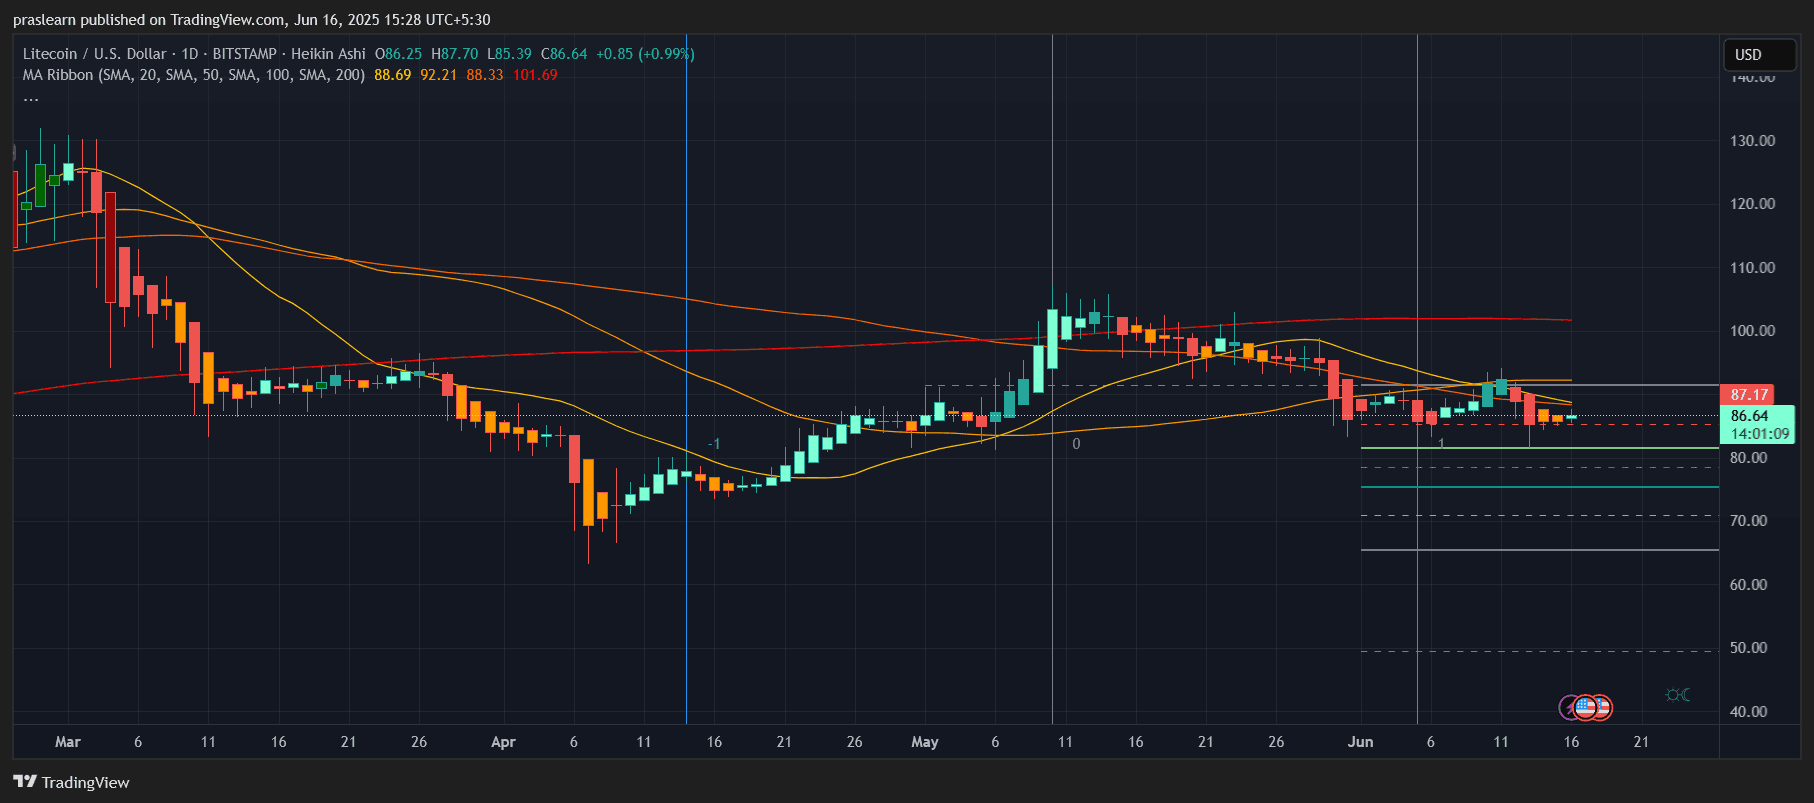
The daily chart shows that Litecoin recently bounced off the $80 support level and is now trading just below a key resistance zone between $87 and $89, which coincides with the 20-day and 50-day simple moving averages. Notably, the 100-day and 200-day SMAs are still above the current price, sitting around $88.33 and $101.69, acting as resistance walls.
From a Heikin Ashi perspective, there is a gradual shift from bearish candles to smaller-bodied candles, signaling the selling momentum may be losing strength. However, a clear bullish reversal pattern hasn't been confirmed yet. If LTC breaks and holds above $89 on strong volume, we may see a swift move to the $96–$100 range.
What Does the Hourly Chart Reveal?
 LTC/USD 1 hr Chart- TradingView
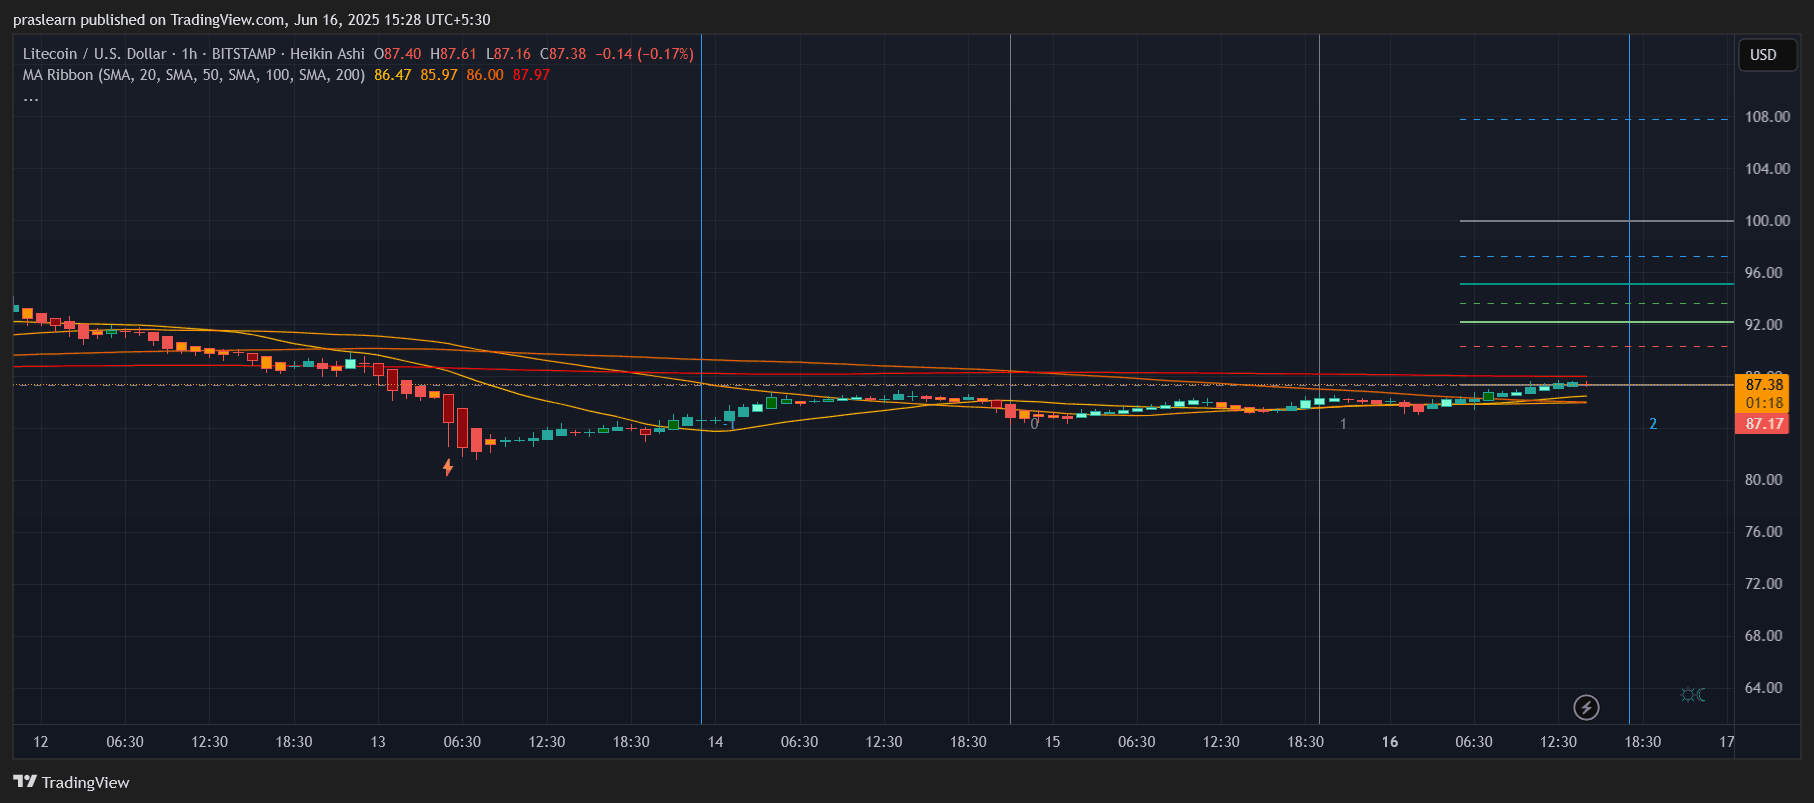
Zooming into the 1-hour chart, Litecoin price is consolidating in a tight range between $86 and $87.50 . The short-term moving averages (20, 50, and 100 SMA) have flattened out, while price is slightly nudging above them—hinting at a possible bullish crossover. The 200 SMA at $87.97 remains the main obstacle in the short-term.
If LTC price breaks the 200 SMA on this timeframe and confirms the breakout with a retest, we could expect a quick run-up toward $92, where historical hourly resistance lies. Above that, $96 and $100 are the next Fibonacci extension targets.
What Do Fibonacci Levels Say?
The daily chart has drawn Fibonacci levels from the previous high near $112 to the recent low near $72. Key levels to watch:
- Fib 0.382 is around $88.50, very close to current resistance
- Fib 0.5 sits near $92.00
- Fib 0.618 is around $96.00
A breakout above $88.50 and sustained hold above $92 would signal a medium-term trend reversal and invite larger bulls.
Let’s use the Fibonacci target calculation to estimate the potential gain:
If LTC breaks above $88.50 (Fib 0.382) and moves to $96.00 (Fib 0.618),
Gain = (96 - 88.50) / 88.50 = 7.5 / 88.50 ≈ 8.47%
This represents a healthy short-term opportunity if volume supports the breakout.
Is There Downside Risk?
Yes, if Litecoin price fails to break above $88.50 this week , sellers might retest $80. A daily close below $80 would open up a slide toward $72 and even $65. Those levels are marked by lower Fib retracements and past price congestion zones.
The 200-day moving average at $101 is also far above the current price, meaning that Litecoin price is still technically in a downtrend. A breakout must be confirmed on higher timeframes to validate a macro recovery.
Litecoin Price Prediction: Bullish or Bearish?
In the short term, Litecoin price looks neutral-bullish . It’s showing early signs of strength on the hourly chart, but the real test is breaking above the $88.50–$89.00 resistance band. If that happens, $92 and $96 are achievable targets. A retest of $100 is likely only if BTC remains above $70K and broader altcoin sentiment improves.
In contrast, failure to clear resistance may push LTC price back to $80 and below. Traders should watch volume spikes closely and monitor the daily close over the next 2–3 sessions.
Final Thoughts
A breakout above $89 could fuel a move to $96–$100. But failure at current levels may drag LTC price back to $80 or lower . The next 48 hours are crucial.
$LTC, $Litecoin
Litecoin (LTC) price has been quietly consolidating beneath key moving averages, and the charts suggest a major move is coming. As of June 16, 2025, LTC price is trading around $86.64 , showing slight strength, but traders are still hesitant as the coin battles resistance from above. Let’s dive into the daily and hourly charts to understand what’s next and calculate the breakout potential.
Litecoin Price Prediction: Is LTC Price Preparing for a Reversal?
LTC/USD 1 Day Chart- TradingView
The daily chart shows that Litecoin recently bounced off the $80 support level and is now trading just below a key resistance zone between $87 and $89, which coincides with the 20-day and 50-day simple moving averages. Notably, the 100-day and 200-day SMAs are still above the current price, sitting around $88.33 and $101.69, acting as resistance walls.
From a Heikin Ashi perspective, there is a gradual shift from bearish candles to smaller-bodied candles, signaling the selling momentum may be losing strength. However, a clear bullish reversal pattern hasn't been confirmed yet. If LTC breaks and holds above $89 on strong volume, we may see a swift move to the $96–$100 range.
What Does the Hourly Chart Reveal?
LTC/USD 1 hr Chart- TradingView
Zooming into the 1-hour chart, Litecoin price is consolidating in a tight range between $86 and $87.50 . The short-term moving averages (20, 50, and 100 SMA) have flattened out, while price is slightly nudging above them—hinting at a possible bullish crossover. The 200 SMA at $87.97 remains the main obstacle in the short-term.
If LTC price breaks the 200 SMA on this timeframe and confirms the breakout with a retest, we could expect a quick run-up toward $92, where historical hourly resistance lies. Above that, $96 and $100 are the next Fibonacci extension targets.
What Do Fibonacci Levels Say?
The daily chart has drawn Fibonacci levels from the previous high near $112 to the recent low near $72. Key levels to watch:
- Fib 0.382 is around $88.50, very close to current resistance
- Fib 0.5 sits near $92.00
- Fib 0.618 is around $96.00
A breakout above $88.50 and sustained hold above $92 would signal a medium-term trend reversal and invite larger bulls.
Let’s use the Fibonacci target calculation to estimate the potential gain:
If LTC breaks above $88.50 (Fib 0.382) and moves to $96.00 (Fib 0.618),
Gain = (96 - 88.50) / 88.50 = 7.5 / 88.50 ≈ 8.47%
This represents a healthy short-term opportunity if volume supports the breakout.
Is There Downside Risk?
Yes, if Litecoin price fails to break above $88.50 this week , sellers might retest $80. A daily close below $80 would open up a slide toward $72 and even $65. Those levels are marked by lower Fib retracements and past price congestion zones.
The 200-day moving average at $101 is also far above the current price, meaning that Litecoin price is still technically in a downtrend. A breakout must be confirmed on higher timeframes to validate a macro recovery.
Litecoin Price Prediction: Bullish or Bearish?
In the short term, Litecoin price looks neutral-bullish . It’s showing early signs of strength on the hourly chart, but the real test is breaking above the $88.50–$89.00 resistance band. If that happens, $92 and $96 are achievable targets. A retest of $100 is likely only if BTC remains above $70K and broader altcoin sentiment improves.
In contrast, failure to clear resistance may push LTC price back to $80 and below. Traders should watch volume spikes closely and monitor the daily close over the next 2–3 sessions.
Final Thoughts
A breakout above $89 could fuel a move to $96–$100. But failure at current levels may drag LTC price back to $80 or lower . The next 48 hours are crucial.
$LTC, $Litecoin
Disclaimer: The content of this article solely reflects the author's opinion and does not represent the platform in any capacity. This article is not intended to serve as a reference for making investment decisions.
You may also like
[Initial Listing] Bitget Will List Datagram (DGRAM) in the Innovation and DePIN Zone
Bitget Spot Margin Announcement on Suspension of L3/USDT, ULTI/USDT Margin Trading Services
Bitget PoolX is listing Planck (PLANCK): Lock BTC to get PLANCK airdrop
Bitget x PLANCK Carnival: Grab a share of 1,880,000 PLANCK!