- Veteran trader Peter Brandt noted that Stellar’s current structure shows strong accumulation, suggesting a highly bullish setup.
- XLM’s recent rally mirrors XRP’s performance, reflecting their historical correlation due to shared use cases and origins.
With a staggering 90% rally over the past month, Stellar (XLM) has stood out from the rest of the altcoin pack, while becoming the 12th largest cryptocurrency with a market cap of $14.3 billion. Market analysts refer to it as the ‘most bullish chart’, mirroring the likes of Ripple XRP, while predicting the continuation of the rally ahead.
Stellar (XLM) Prepares for Another 35% Rally
Stellar (XLM) is currently consolidating within an ascending triangle, suggesting a potential breakout moving forward. The key resistance near $0.52 has been tested multiple times since Tuesday, while the formation of higher lows indicates mounting buying pressure.
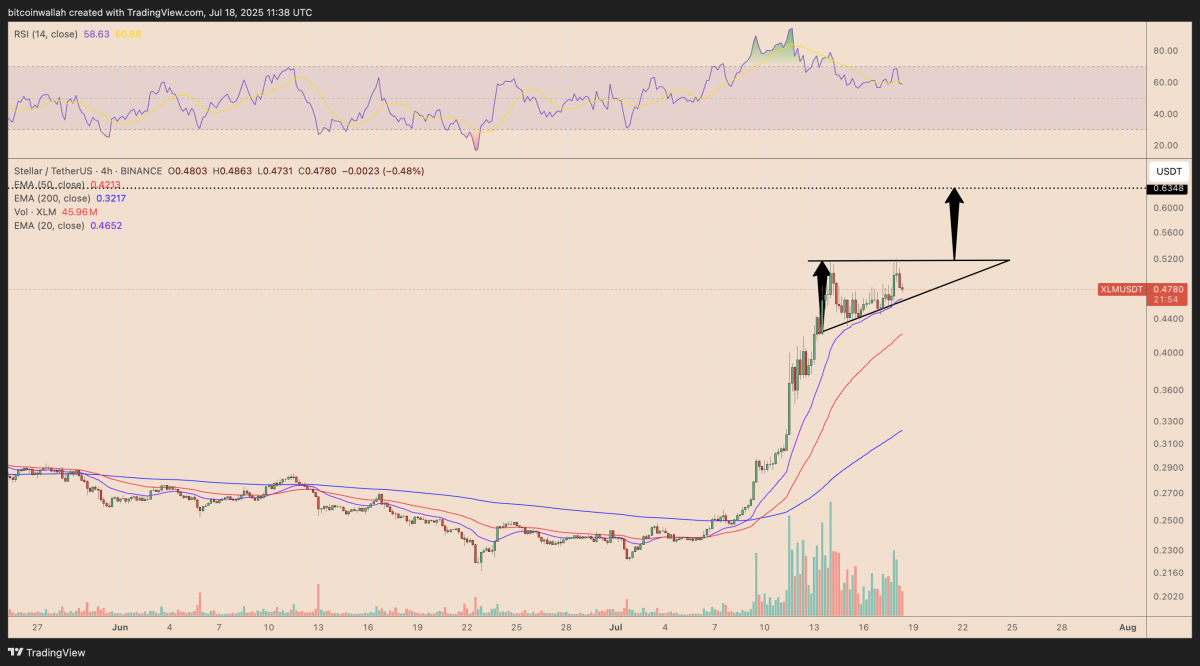 Source: TradingView
A confirmed breakout above $0.52 could validate the pattern and set the stage for a rally toward $0.63 by August, representing a 35% gain from current levels. This price target is calculated by adding the triangle’s maximum height to the breakout point, as shown in the image above.
Meanwhile, XLM continues to trade above its 20-, 50-, and 200-period exponential moving averages (EMAs), all of which are trending higher, further bolstering both short- and medium-term bullish sentiment. As mentioned in the previous report, XLM price could be gearing up for a 2x rally.
Additionally, veteran trader Peter Brandt also stated that the current bullish pattern for Stellar Lumens (XLM) highlights a strong accumulation structure. Brandt believes Stellar (XLM) has the potential to be the “most bullish chart” in the crypto market,but only if it can decisively close above the key $1 resistance level. While XLM has tested this horizontal barrier in the past, it has yet to break through with strong conviction.
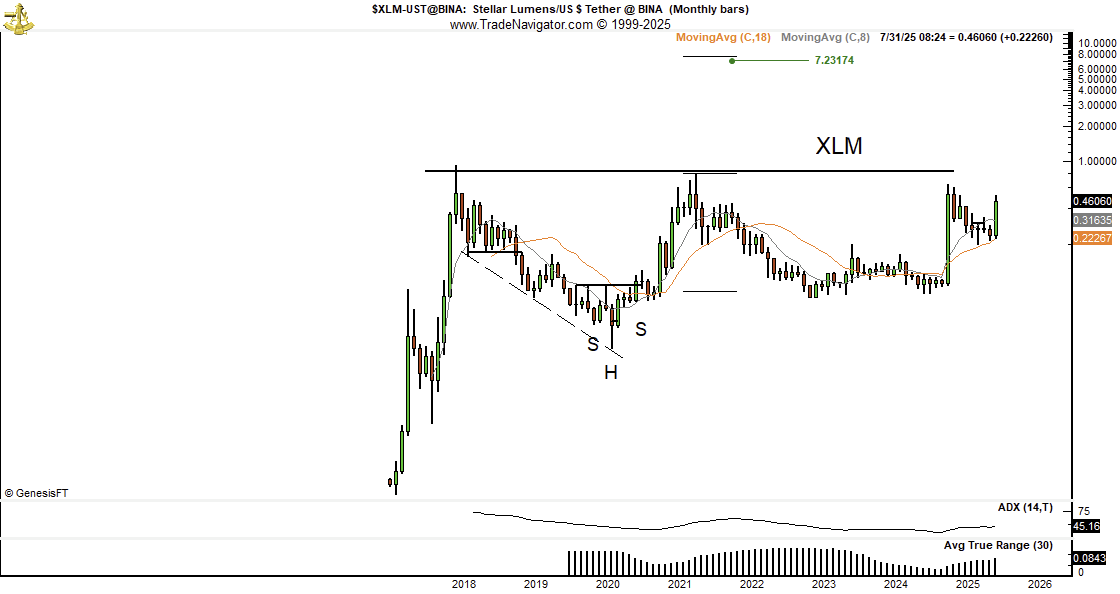 Source: Peter Brandt
Sharing Strong Correlation With XRP
Market analysts also point out that the 90% run-up witnessed in the XLM price over the past week bears a strong correlation with XRP’s 60% rally during the same period. On a wider time frame, Stellar (XLM) continues to lag behind XRP in terms of price performance. Since the November low, XLM has surged approximately 425%, while XRP has outpaced it with gains of over 590% during the same period.
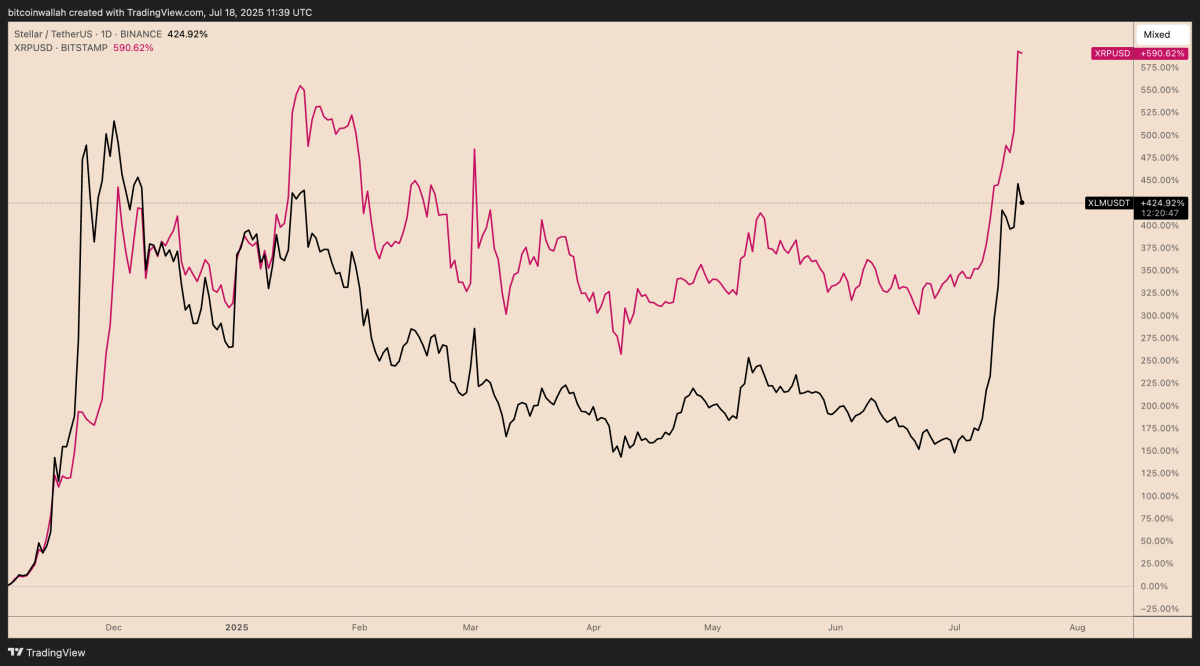 Source: TradingView
XLM’s recent outperformance points to a classic catch-up rally, a pattern often observed when XRP leads bullish market moves. The two assets have historically shown a strong directional correlation, driven by their shared origins and similar roles in cross-border payments.
During bullish phases, the correlation coefficient between XLM and XRP frequently exceeds 0.70, indicating closely aligned price action. A clear example occurred in July 2023, when a favorable U.S. court ruling in Ripple’s case triggered a 60% surge in XRP, momentum that XLM soon mirrored.