- SOL trades at $190.74 after gaining 5.8% in 24 hours, with rising volume and renewed buying interest.
- The $179.07 level has flipped to support following the recent weekly close, forming a new base.
- SOL now faces immediate resistance at $191.84 as volume surges to $8.89B, up 76.5% daily.
Solana’s price action entered a critical phase this week following a firm weekly close above a key resistance zone. The asset trades at $190.74 , gaining 5.8% in the past 24 hours. This upward move came alongside a sharp increase in trading volume, which rose 76.5% to reach $8.89 billion. The weekly close above $179.07 established a support foundation last seen earlier in the quarter.
Notably, the price now trades within close range of the $191.84 resistance. This level aligns with previous weekly wicks, forming a technical barrier that traders are currently watching. As SOL approaches this threshold, market behavior continues to reflect strength, driven by increased capital inflow and consistent demand near recent lows.
Support Zone Holds Following Consistent Volume Spike
The $179.07 level acted as resistance in prior sessions but has now been flipped into support. This flip became evident after the latest weekly close confirmed buyer strength above this level. SOL has also remained above the $169.00 and $147.87 zones, further solidifying a rising structure.
Support at $179 aligns with a multi-week consolidation range. That zone has previously attracted significant volume, making it relevant for upcoming sessions. Buyers now aim to sustain prices above this area while targeting higher resistance levels.
The next support lies well below current price at $147.87, which last acted as a structural pivot during early July. For now, the focus remains on holding the $179 level under increased volume conditions.
Resistance Nears as Market Cap Hits $102.68 Billion
With a current market cap of $102.68 billion, SOL ranks among the highest-cap crypto assets. The price now approaches the previous resistance of $191.84 steadily and, as such, it is the immediate obstacle to further price increase. The 24-hour interval ranges between $179.07 and 191.84, with the volatility maintained within known boundaries.
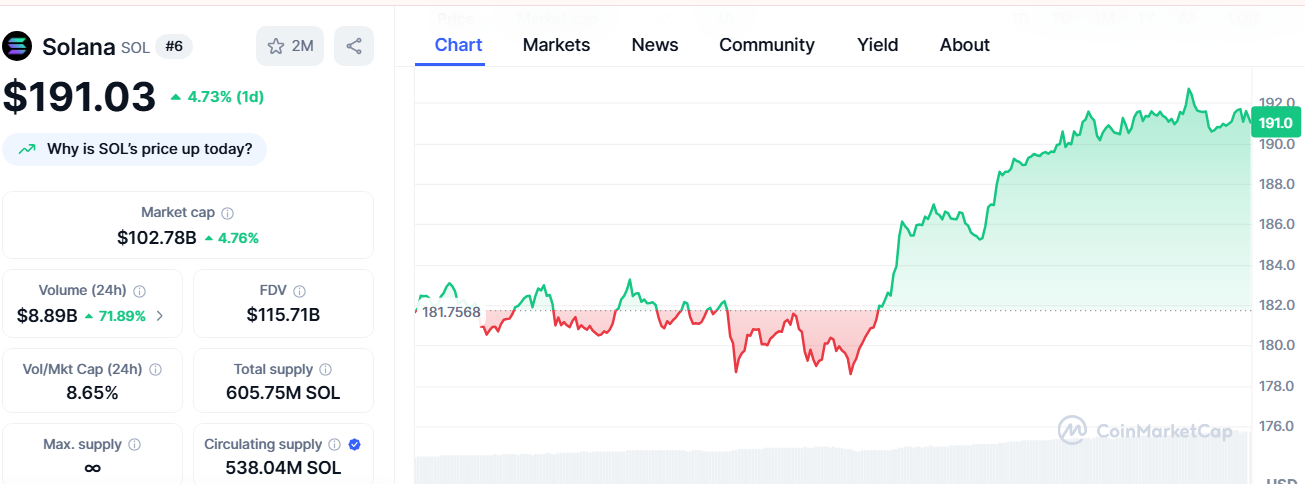 Source: CoinMarketCap
Since volume is high, technical levels offer a conceptual model to direction in the short-term. SOL’s ability to sustain above $179 will be important while testing the resistance at $191.84. The current chart structure presents a defined range with support and resistance clearly established.