Key takeaways:
-
Ether dropped to $3,500 on Thursday, but onchain data shows no signs of a deeper drop, suggesting more growth potential in 2025.
-
ETH price resistance at $4,500 remains the main barrier for now.
Market analysts say Ether’s ( ETH ) uptrend remains intact despite the latest 9% drop from its seven-month highs.
Data from Cointelegraph Markets Pro and TradingView shows that Ether’s price action reclaimed the $3,600 level after a flash crash to $3,500 during the early Asian trading hours on Thursday.
Ether price faces “lower selling pressure”
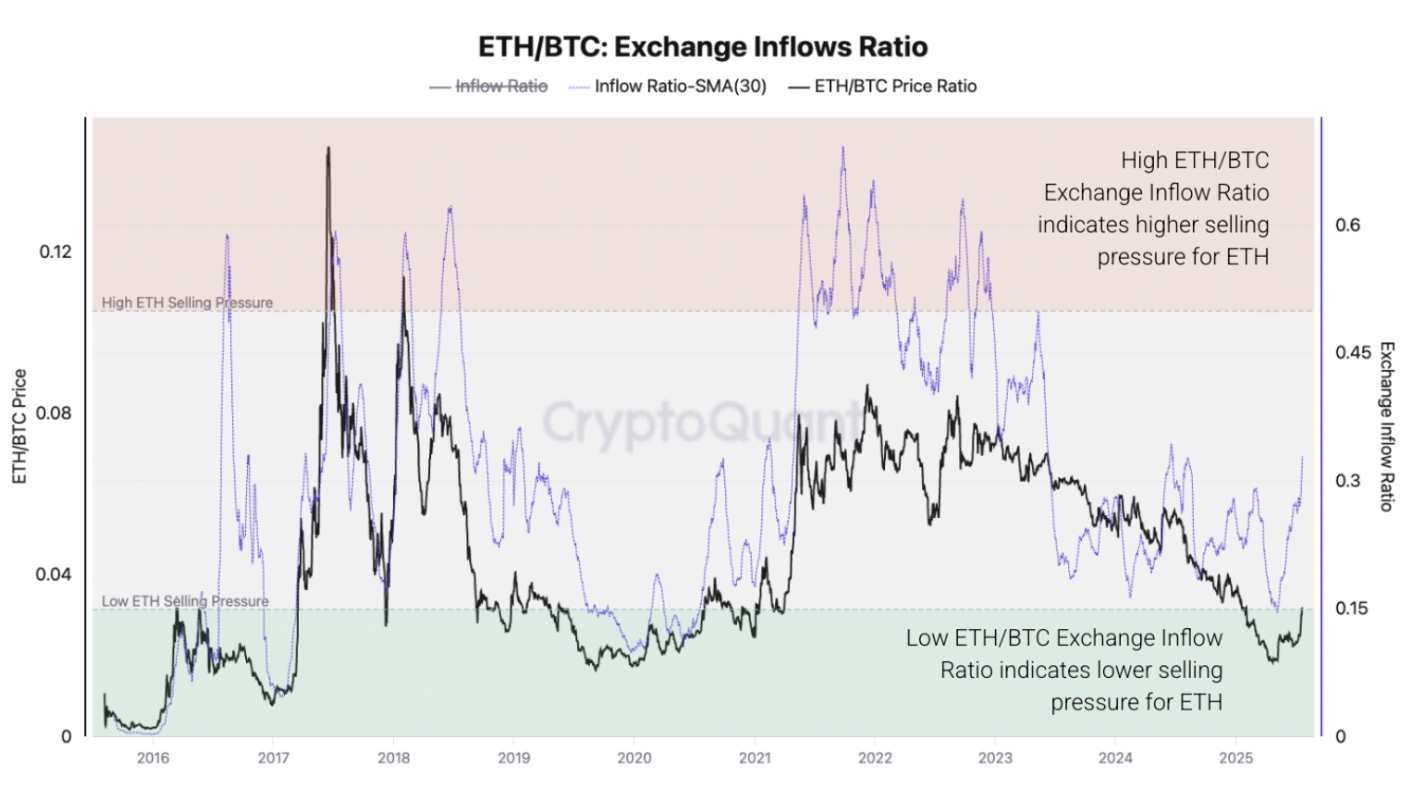
The ETH/BTC exchange inflows ratio suggests that Ether’s “outperformance could continue as it still faces relatively lower selling pressure than Bitcoin,” onchain data provider CryptoQuant said in its latest Weekly Crypto Report.
Related: Ethereum whale nets $9.87M profit as ETH snaps 8-day winning streak
The chart below shows that the ratio dropped to its five-year lows in May, suggesting that ETH was facing much lower relative sell-pressure than BTC.
Since then, the ratio has increased, but it is still far from extremely high levels (red area). This indicates significantly less ETH is being sent to exchanges compared to Bitcoin, supporting further gains in ETH/BTC.
“Lower ETH/BTC exchange inflow ratio indicates lower selling pressure for ETH,” CryptoQuant wrote, adding:
“This continues to be a bullish signal for ETH relative to Bitcoin, potentially supporting further upside in the ETH/BTC pair.”
![]()
ETH/BTC exchange inflows ratio. Source: CryptoQuant
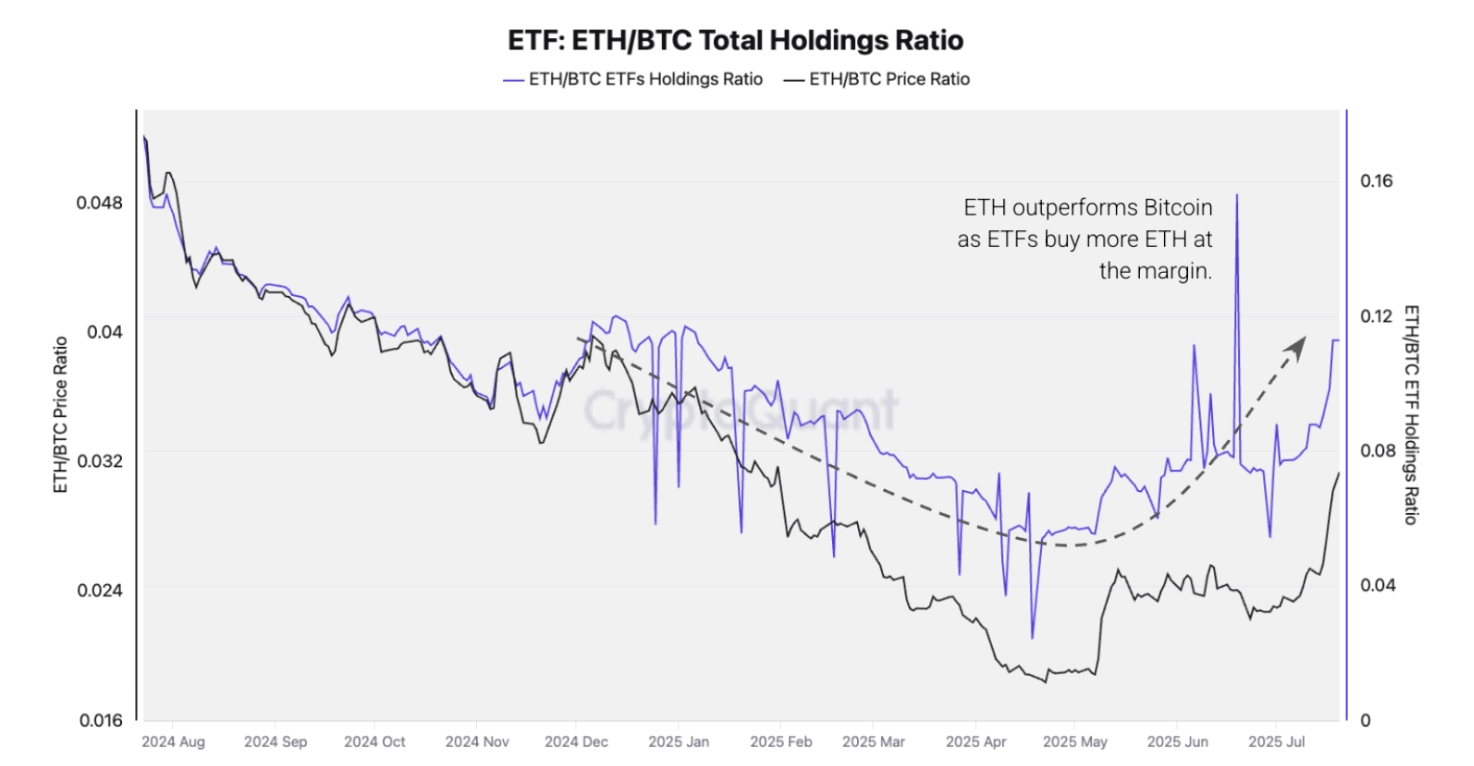
The potential continuation of Ether’s outperformance is also supported by the ETH/BTC ETF Holding Ratio, which has increased to 0.12 from 0.02 in May.
This indicates that investors are “gaining relatively more exposure to ETH than Bitcoin,” the firm explained. It points to “increasing demand for ETH at the margin, and adding to ETH’s price outperformance.”
![]()
ETH/BTC ETF holding ratio. Source: CryptoQuant
Meanwhile, spot Ethereum ETFs continue to show strength, marking their first year since launch by notching their seventh-best day of inflows ever with $332.2 million on Wednesday. Conversely, spot Bitcoin ETFs have seen a three-day streak of outflows totaling $285.2 million.
In fact, spot Ether ETFs have taken in nearly $8.7 million in net inflows and now wield over $16.6 billion in assets under management.
🇺🇸 UPDATE: US spot Ether ETFs hit $16.6B AUM on their 1-year anniversary, with a $3.9B inflow streak over the past 3 weeks. pic.twitter.com/acmxKx1wve
— Cointelegraph (@Cointelegraph) July 24, 2025
Onchain data reveals ETH price levels to watch
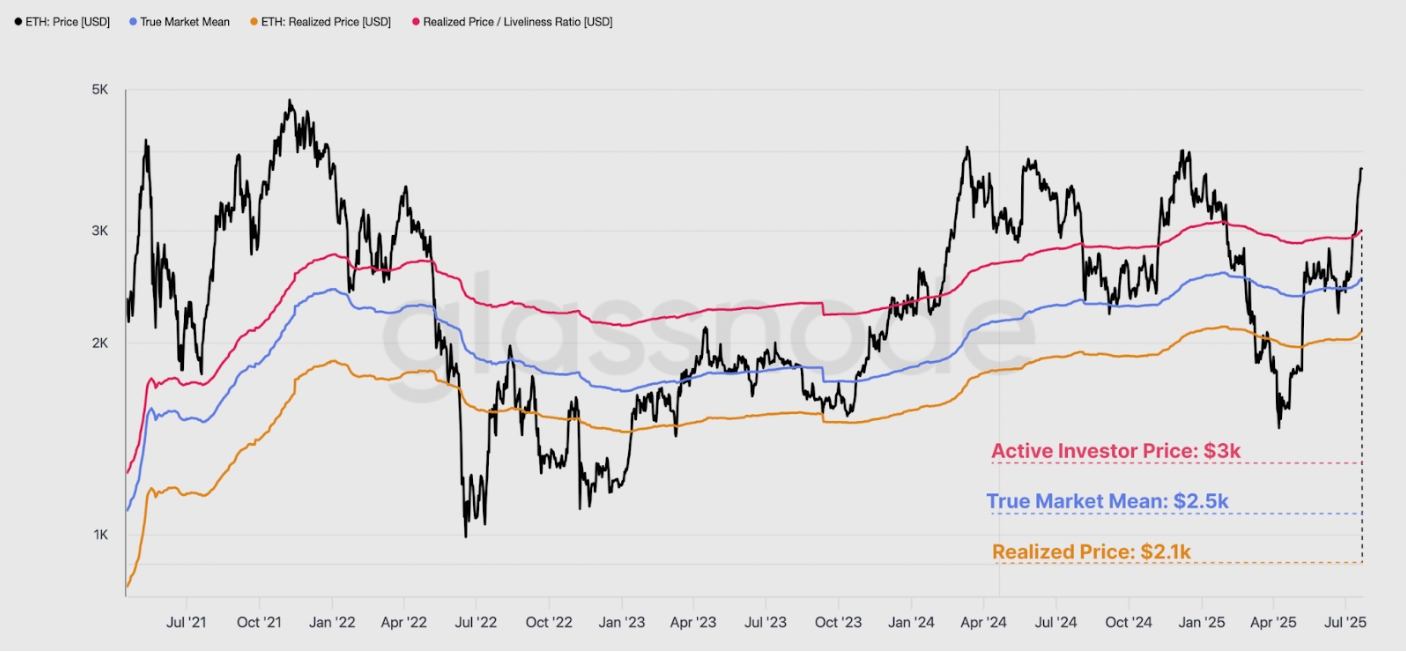
Using Ether’s cost basis model, Glassnode analysts outline key levels that traders should focus on.
This model uses the average purchase prices of ETH, including the true market mean and the active realized price, offering a clearer picture of the average price paid by economically active investors compared to the realized price.
On the downside, the major support level sits between $2,000 and $3,000, represented by the realized price at $2,100, the true market mean at $2,500, and the active realized price at $3,000.
Glassnode added:
“This price range would serve as an important level of support in the event that the price corrects back toward it.”
![]()
Ether’s key pricing levels. Source: Glassnode
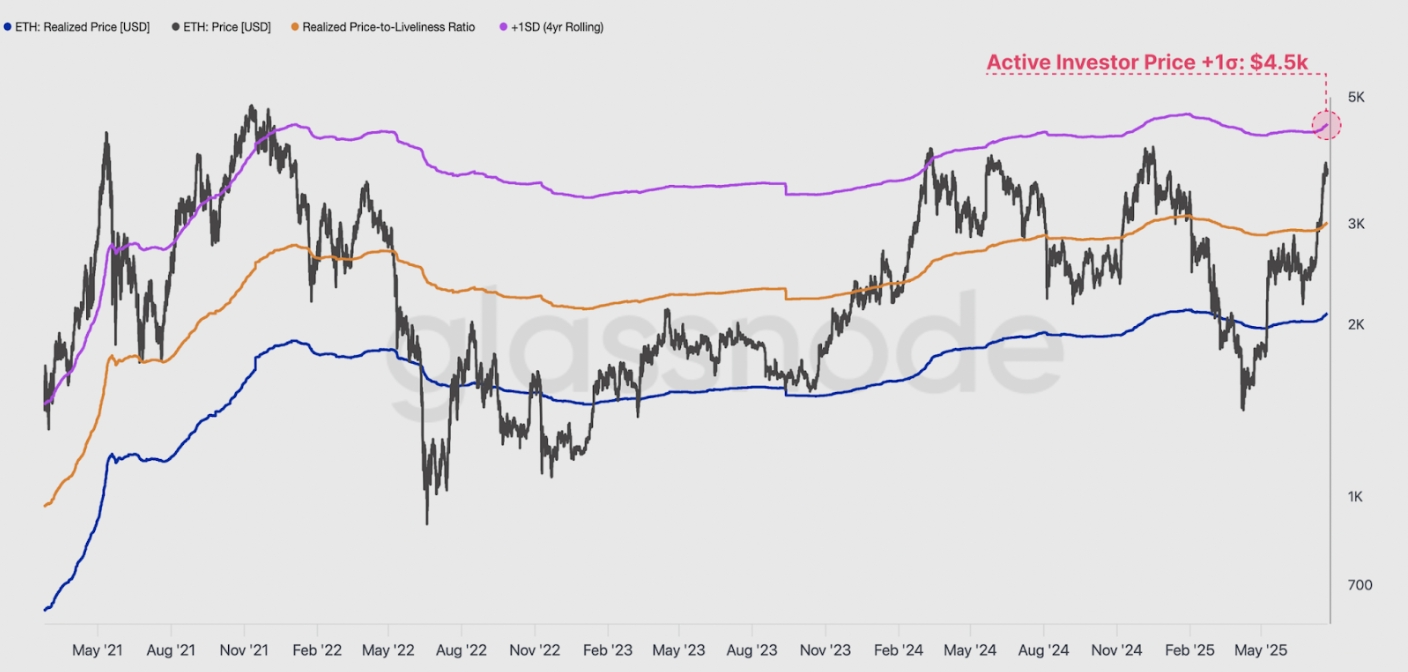
Above, the first major resistance sits at $4,500, representing the Ether’s active realized price pushed one standard deviation higher.
This price band has historically served as a resistance level, as seen back in March 2024 as well as during the prior 2020-21 cycle.
“Breakouts above this threshold tend to coincide with heightened market euphoria, and unsustainable market structure, Glassnode wrote, adding:
“As such, $4,500 can be identified as a critical level to watch on the upside, especially if Ethereum’s uptrend continues and speculative froth builds further.”
![]()
ETH realized price-to-liveness ratio. Source: Glassnode
As Cointelegraph reported , ETH bulls must push the price above $3,860 to open the doors for the next leg of the rally to $4,000.