Date: Mon, July 28, 2025 | 06:35 AM GMT
The broader cryptocurrency market continues to ride a bullish wave, led by Ethereum (ETH), which has jumped 62% over the past 30 days and is now trading above $3,900. This momentum is spilling into leading memecoins , with Pepe (PEPE) showing signs of a potential rally ahead.
PEPE has continued its bullish run, boosting its monthly gains to 40%. Beyond the price action, its chart is forming a harmonic pattern that suggests the possibility of more upside move in the near term.
 Source: Coinmarketcap
Harmonic Pattern Hints at Bullish Continuation
On the daily chart, PEPE is shaping a Bearish ABCD harmonic pattern — a structure that, despite the “bearish” label, often delivers a powerful bullish CD leg before any potential reversal.
The pattern started in March from Point A near $0.00000525, surged sharply to Point B, and then retraced to Point C near $0.00000831 by late June. Since then, PEPE has been climbing steadily and is now trading near $0.00001305.
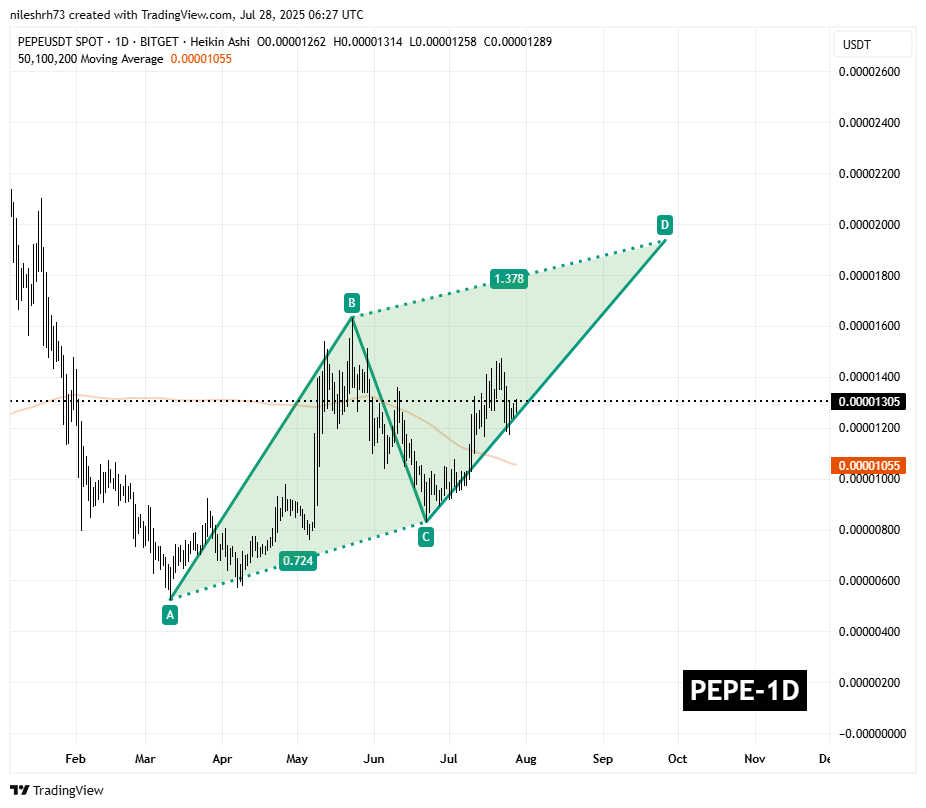 PEPE Daily Chart/Coinsprobe (Source: Tradingview)
The CD leg — the final and typically strongest phase — is in motion. If PEPE follows the traditional ABCD framework, the move could complete near the 1.378 Fibonacci extension of the BC leg, projecting a target around $0.00001936, which represents the Potential Reversal Zone (PRZ).
What’s Next for PEPE?
If the CD leg continues as expected, PEPE could see an additional 48% upside, climbing toward $0.00001936. However, this level will act as a key resistance zone, where traders typically monitor for profit-taking or short-term pullbacks.
Despite the possibility of minor retracements, PEPE’s structure remains bullish as long as it holds above its 200-day moving average, currently near $0.00001055.