Solana Price Breaks Below $165: ETF Hype Fades, Fed Fuels Decline
Why Did Solana Price Crash?
Solana's strong run in July—fueled by ETF rumors—ran out of steam. Without confirmation, and following the Fed's decision to pause rate changes, SOL saw a wave of selling. Combined with Bitcoin’s decline , Solana lost over 6.6% on the week and broke below $165.
SOL Coin Chart Breakdown
SOL/USD 4-hours chart - TradingView
- SOL broke $175.8 and $170 support, now trading near $163.73
- Next critical level: $160, psychological and technical
- RSI is deeply oversold at 22.87, flashing bounce potential
- 9 and 21 EMAs are clearly trending lower → full downtrend confirmation
What to Watch Next for SOL
- If $160 fails, expect a move toward $150 or even $142.
- Bulls must reclaim $170, then $175.80 to regain structure.
- A short-term bounce is likely due to oversold RSI, but it may be short-lived without macro improvement.
Watch if volume spikes on dips – this could signal smart money accumulation.
Disclaimer: The content of this article solely reflects the author's opinion and does not represent the platform in any capacity. This article is not intended to serve as a reference for making investment decisions.
You may also like
Coinpedia Digest: This Week’s Crypto News Highlights | 29th November, 2025
QNT Price Breaks Falling Wedge: Can the Bullish Structure Push Toward $150?

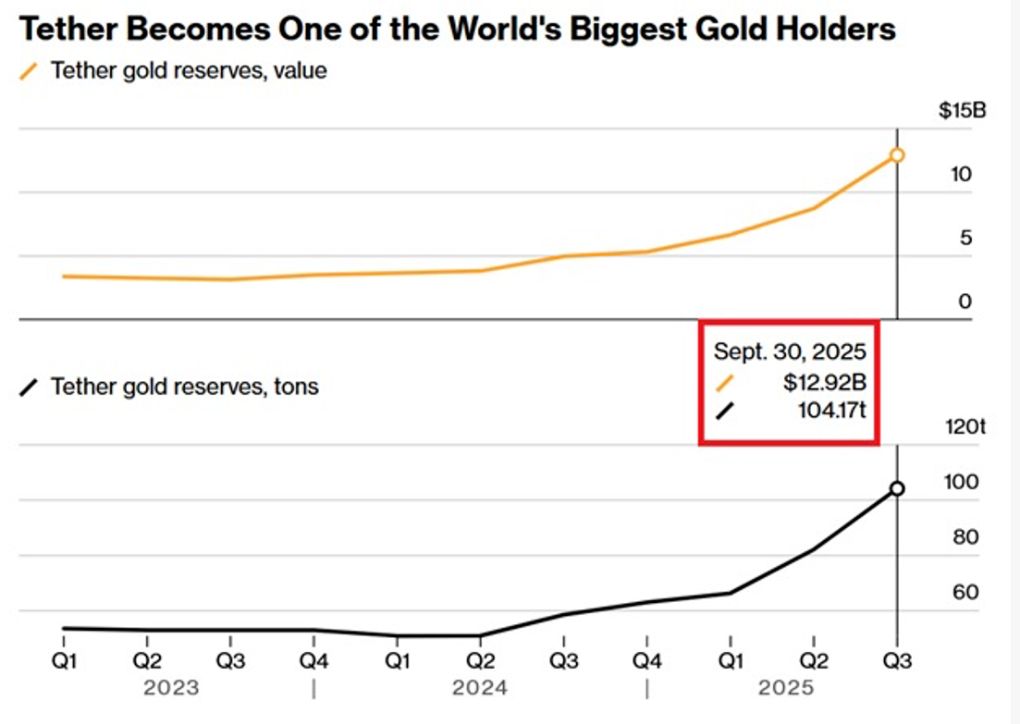
Digital dollar hoards gold, Tether's vault is astonishing!

The Crypto Bloodbath Stalls: Is a Bottom In?

