Chainlink (LINK) is holding a crucial support level near $16.15, forming a bullish structure with potential price targets at $32 and $51, supported by rising whale accumulation and strong liquidity below $15.
-
LINK forms a higher low near $16.15, signaling a bullish continuation with targets at $32 and $51.
-
Liquidity is building under $15 as LINK retests its 200-day EMA, indicating a potential strong rebound.
-
Whale holdings have increased by 13%, while exchange supply has decreased, reinforcing a long-term bullish outlook for LINK.
Chainlink (LINK) holds key support near $16.15, forming a bullish structure with targets at $32 and $51 amid rising whale accumulation. Stay informed with COINOTAG.
LINK Maintains Uptrend as Key Support Holds Near $16.15
Chainlink (LINK) is currently retesting a critical support level around $16.15, forming a higher low that supports a bullish price structure. According to Solberg Invest, this setup indicates a potential rally with long-term targets at $32 and $51. The breakout above a descending trendline since February confirms this positive momentum, with LINK recently pulling back from a local high near $18 to retest the breakout zone.
Technical Indicators Signal Potential Rebound
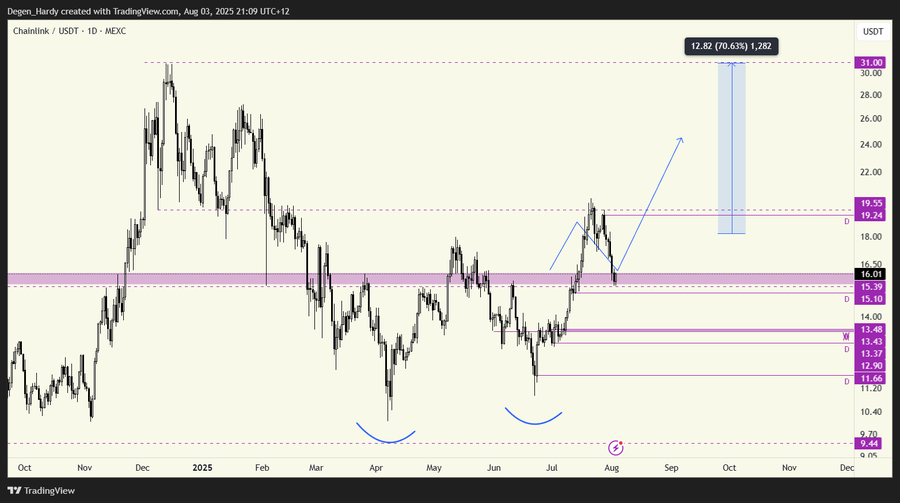
LINK is testing its 200-day Exponential Moving Average (EMA) after falling below the 20-day and 50-day moving averages. Holding the 200-day EMA is crucial for sustaining upward momentum, with possible price advances toward $20, then $25, and eventually $40. The ascending broadening wedge pattern further supports a long-term bullish outlook. Market analyst Hardy notes that liquidity accumulation under $15 suggests strong buyer interest, although clear long triggers have yet to emerge.
Chainlink (LINK) holds key support near $16.15, forming a bullish structure with targets at $32 and $51 amid rising whale accumulation.
- LINK forms higher low near $16.15, maintaining a bullish structure with targets set at $32 and $51.
- Liquidity builds under $15 as LINK retests 200-day EMA, signaling potential for strong rebound.
- Whale holdings rise 13% while exchange supply drops, supporting a long-term bullish outlook for LINK.
Chainlink (LINK) is currently retesting a key support level following a pullback from its July peak near $20. The asset is forming a higher low on the daily chart, which supports the continuation of a bullish structure. At the time of writing, LINK is trading around $16.15.

Market Conditions Support Bullish Structure for LINK
The Relative Strength Index (RSI) for LINK stands at 43.52, reflecting neutral momentum and room for price movement in either direction. The Moving Average Convergence Divergence (MACD) histogram indicates mild bearish momentum but lacks acceleration, suggesting potential stabilization. Data from blockchain analytics firm Nansen reveals that whale holdings have increased by 13% to 3.84 million LINK since early July. Concurrently, LINK balances on exchanges have declined from 283 million to 276.88 million, signaling reduced selling pressure.
How Does Whale Accumulation Impact LINK’s Price Outlook?
Whale accumulation plays a significant role in LINK’s bullish outlook. As large holders increase their positions by 13%, the available supply on exchanges diminishes, reducing selling pressure and increasing scarcity. This dynamic often precedes upward price movements, as observed in previous market cycles. The current pattern aligns with Elliott Wave theory, suggesting a continuation toward the $32 target, with $51 as a longer-term objective.
$LINK Bull Targets:
We may see a retest before a new rally, forming a higher low, which is bullish.
My targets are $32 and $51 for $LINK.
Are you buying the dip? pic.twitter.com/EB3bGozjoL
— Solberg Invest 🧢 (@SolbergInvest) August 2, 2025
Technical analysis confirms LINK’s retest of the 200-day EMA as a critical juncture. If support holds, the asset could embark on a new upward leg, potentially reaching $20, then $25, and beyond. The ascending broadening wedge pattern remains intact, reinforcing the bullish case. Market expert Hardy emphasizes the importance of liquidity building under $15, which could fuel a strong rebound once triggered.
 Source: Hardy(X)
What Are the Key Technical Indicators for LINK’s Price Movement?
LINK’s RSI at 43.52 indicates balanced momentum, allowing for potential upward or downward price shifts. The MACD histogram shows mild bearish momentum but no acceleration, suggesting the current downtrend may be stabilizing. The 200-day EMA serves as a critical support level; maintaining this support is essential for the next bullish phase. Whale accumulation and declining exchange supply further strengthen the bullish technical outlook.
Why Is Liquidity Below $15 Important for LINK?
Liquidity accumulation below $15 is crucial as it represents a price zone where strong buying interest is concentrated. This liquidity acts as a cushion against further price declines and can trigger a rebound when buyers step in. Market analyst Hardy highlights this zone as a key area for potential long entries, which could catalyze the next upward rally.
Frequently Asked Questions
What is the significance of LINK’s 200-day EMA retest?
Retesting the 200-day EMA is significant as it acts as a major support level. Holding this support can confirm a bullish trend continuation and attract buyers aiming for higher price targets.
How do whales influence Chainlink’s market dynamics?
Whales influence the market by accumulating large amounts of LINK, which reduces circulating supply on exchanges and can drive prices higher as demand outpaces available tokens.
Key Takeaways
- Critical Support: LINK holds key support near $16.15, forming a bullish higher low.
- Whale Accumulation: Large holders increased positions by 13%, reducing exchange supply.
- Technical Indicators: RSI and MACD suggest stabilization, with the 200-day EMA as a pivotal support.
Conclusion
Chainlink (LINK) is demonstrating a strong bullish structure by maintaining support near $16.15 and showing rising whale accumulation. Technical indicators and liquidity patterns support potential rallies toward $32 and $51. Investors should monitor these key levels and market signals for informed decision-making as LINK aims to continue its upward trajectory.