Date: Mon, Aug 04, 2025 | 11:30 AM GMT
The cryptocurrency market is showing signs of a mild recovery after a sharp correction, with Ethereum (ETH) rebounding to $3550 from its recent low of $3357. As momentum returns, several altcoins and memecoins are starting to show strength — including Dogwifhat (WIF).
WIF is trading back in the green today, posting modest gains. Its chart is now highlighting the emergence of a symmetrical triangle pattern, a technical structure that could be setting the stage for a potential upside move.
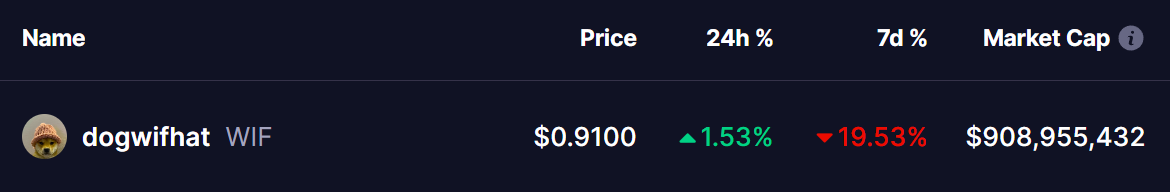 Source: Coinmarketcap
Symmetrical Triangle in Play?
On the daily timeframe, WIF is developing a classic symmetrical triangle — a pattern typically considered neutral but often leading to strong price movement once a breakout occurs. The coin recently pulled back after facing rejection near the upper boundary of the triangle around $1.32.
That rejection sent WIF sliding back to the lower trendline near $0.82, where it found support — not only at the triangle’s baseline but also from the 200-day moving average.
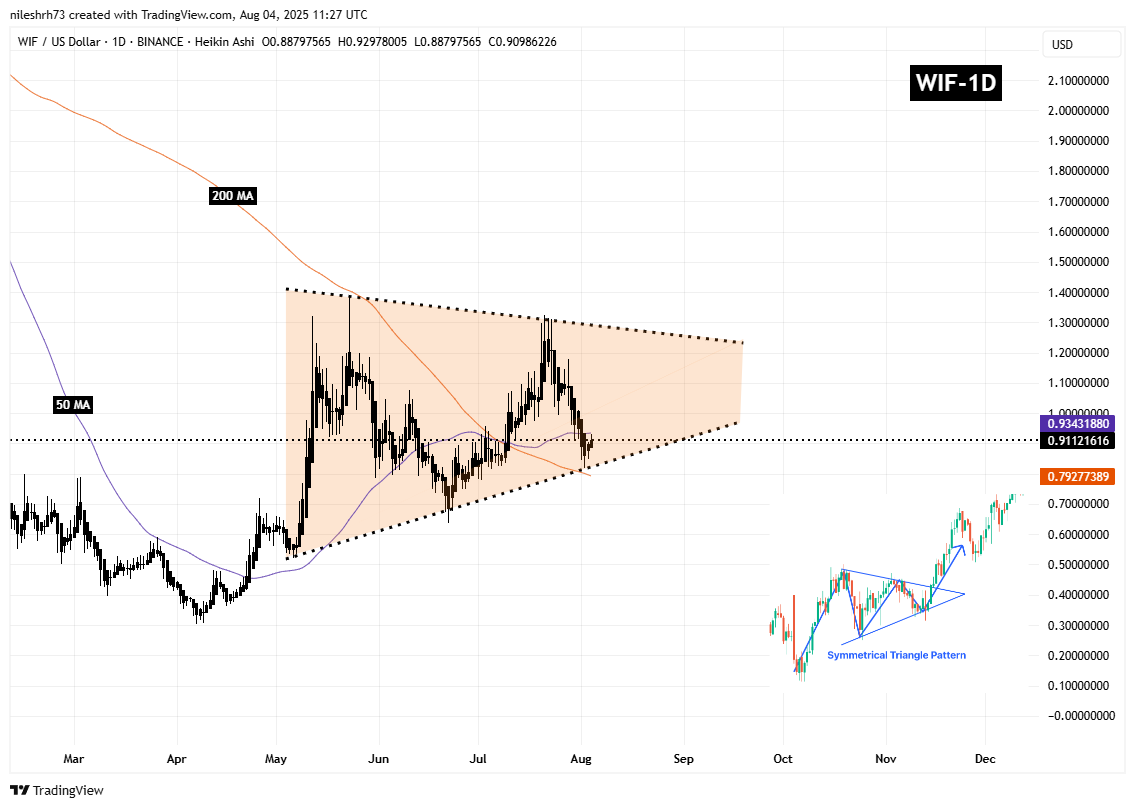 Dogwifhat (WIF) Daily Chart/Coinsprobe (Source: Tradingview)
This confluence of technical support helped initiate a bounce, pushing WIF back above $0.91. It is currently attempting to clear resistance at the 50-day moving average, located at $0.9343.
What’s Next for WIF?
WIF’s near-term outlook will likely hinge on how it behaves around these key technical levels. A successful breakout above the 50-day MA could trigger bullish momentum, potentially carrying the price back toward the triangle’s upper boundary near $1.24 — a move that would reflect over 36% upside from current levels.
However, for this setup to remain valid, WIF must hold its footing above the 200-day MA at $0.79. A breakdown below this level could invalidate the triangle pattern and open the door to further downside.