Notcoin Bears in Control — Two Metrics Suggest It’s “NOT” In Free Fall Yet

Notcoin price has fallen 14% this week and sits near its all-time low. Exchange inflows remain high, but top whale buying and one bullish divergence could offer a lifeline — if conditions align.
Notcoin price has corrected nearly 14% in the past week and 28% over the last three months. It has failed to join the broader market rally, and its price action now sits just 19.4% above its all-time low.
Heavy selling near these levels is rarely a bullish signal, but a closer look reveals two metrics that could still influence the outcome, if they align in Notcoin’s favor.
Exchange Inflows Show Panic Selling Despite Whale Buys
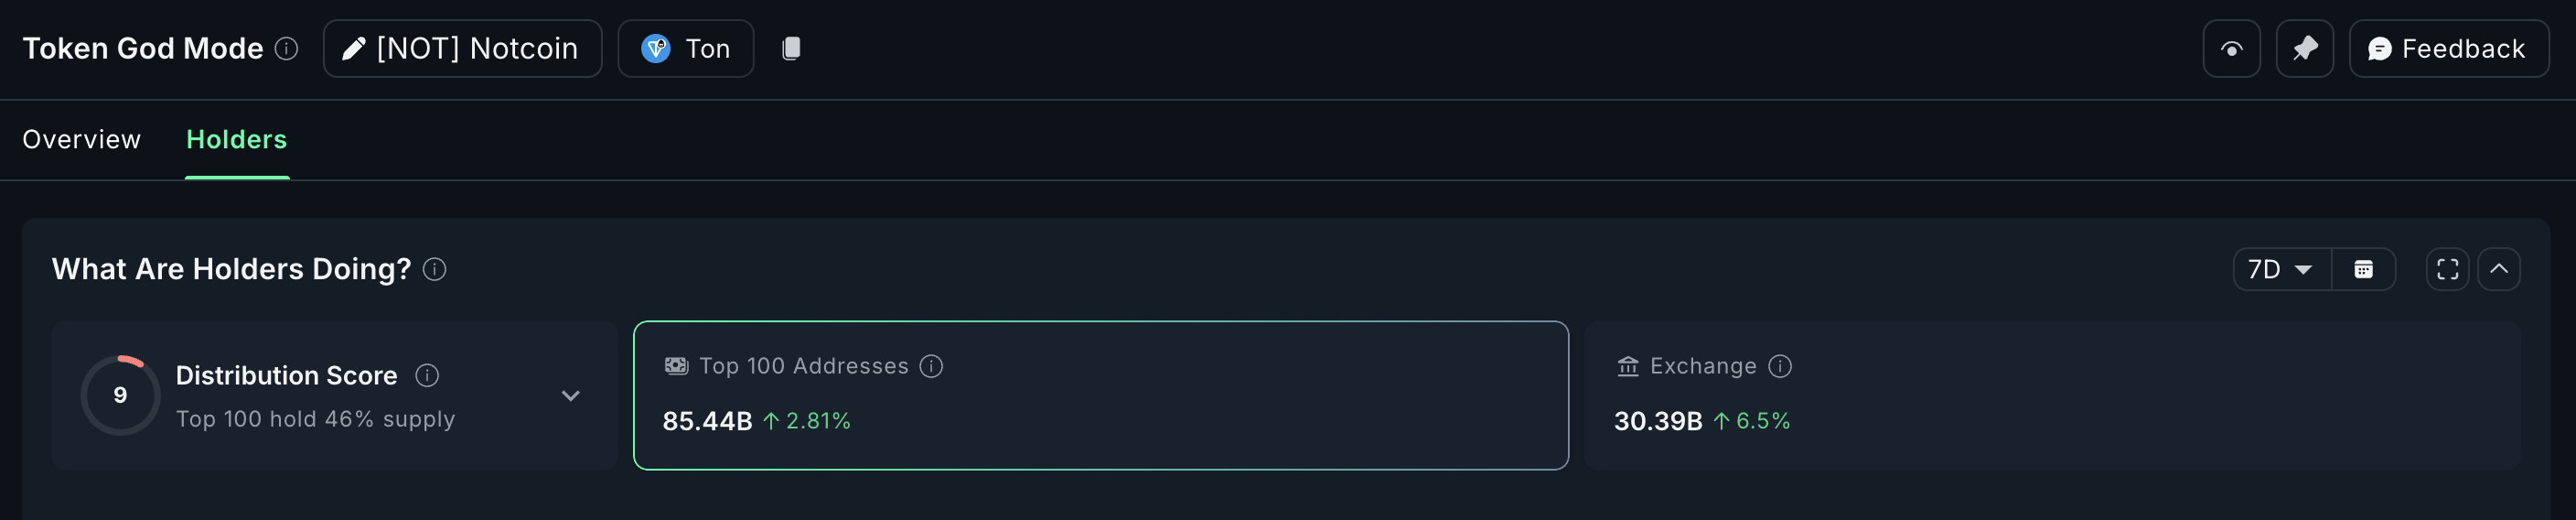
Over the past seven days, exchange inflows have risen 6.5%, pushing total exchange balances to 30.39 billion NOT. This is a clear sign of retail-driven selling pressure, especially with the Notcoin price hovering close to an all-time low.
 Notcoin inflows keep surging:
Interestingly, the top 100 addresses have been net buyers during this period. If these large holders keep accumulating while exchange inflows slow and eventually flip to outflows, market sentiment could begin to shift.
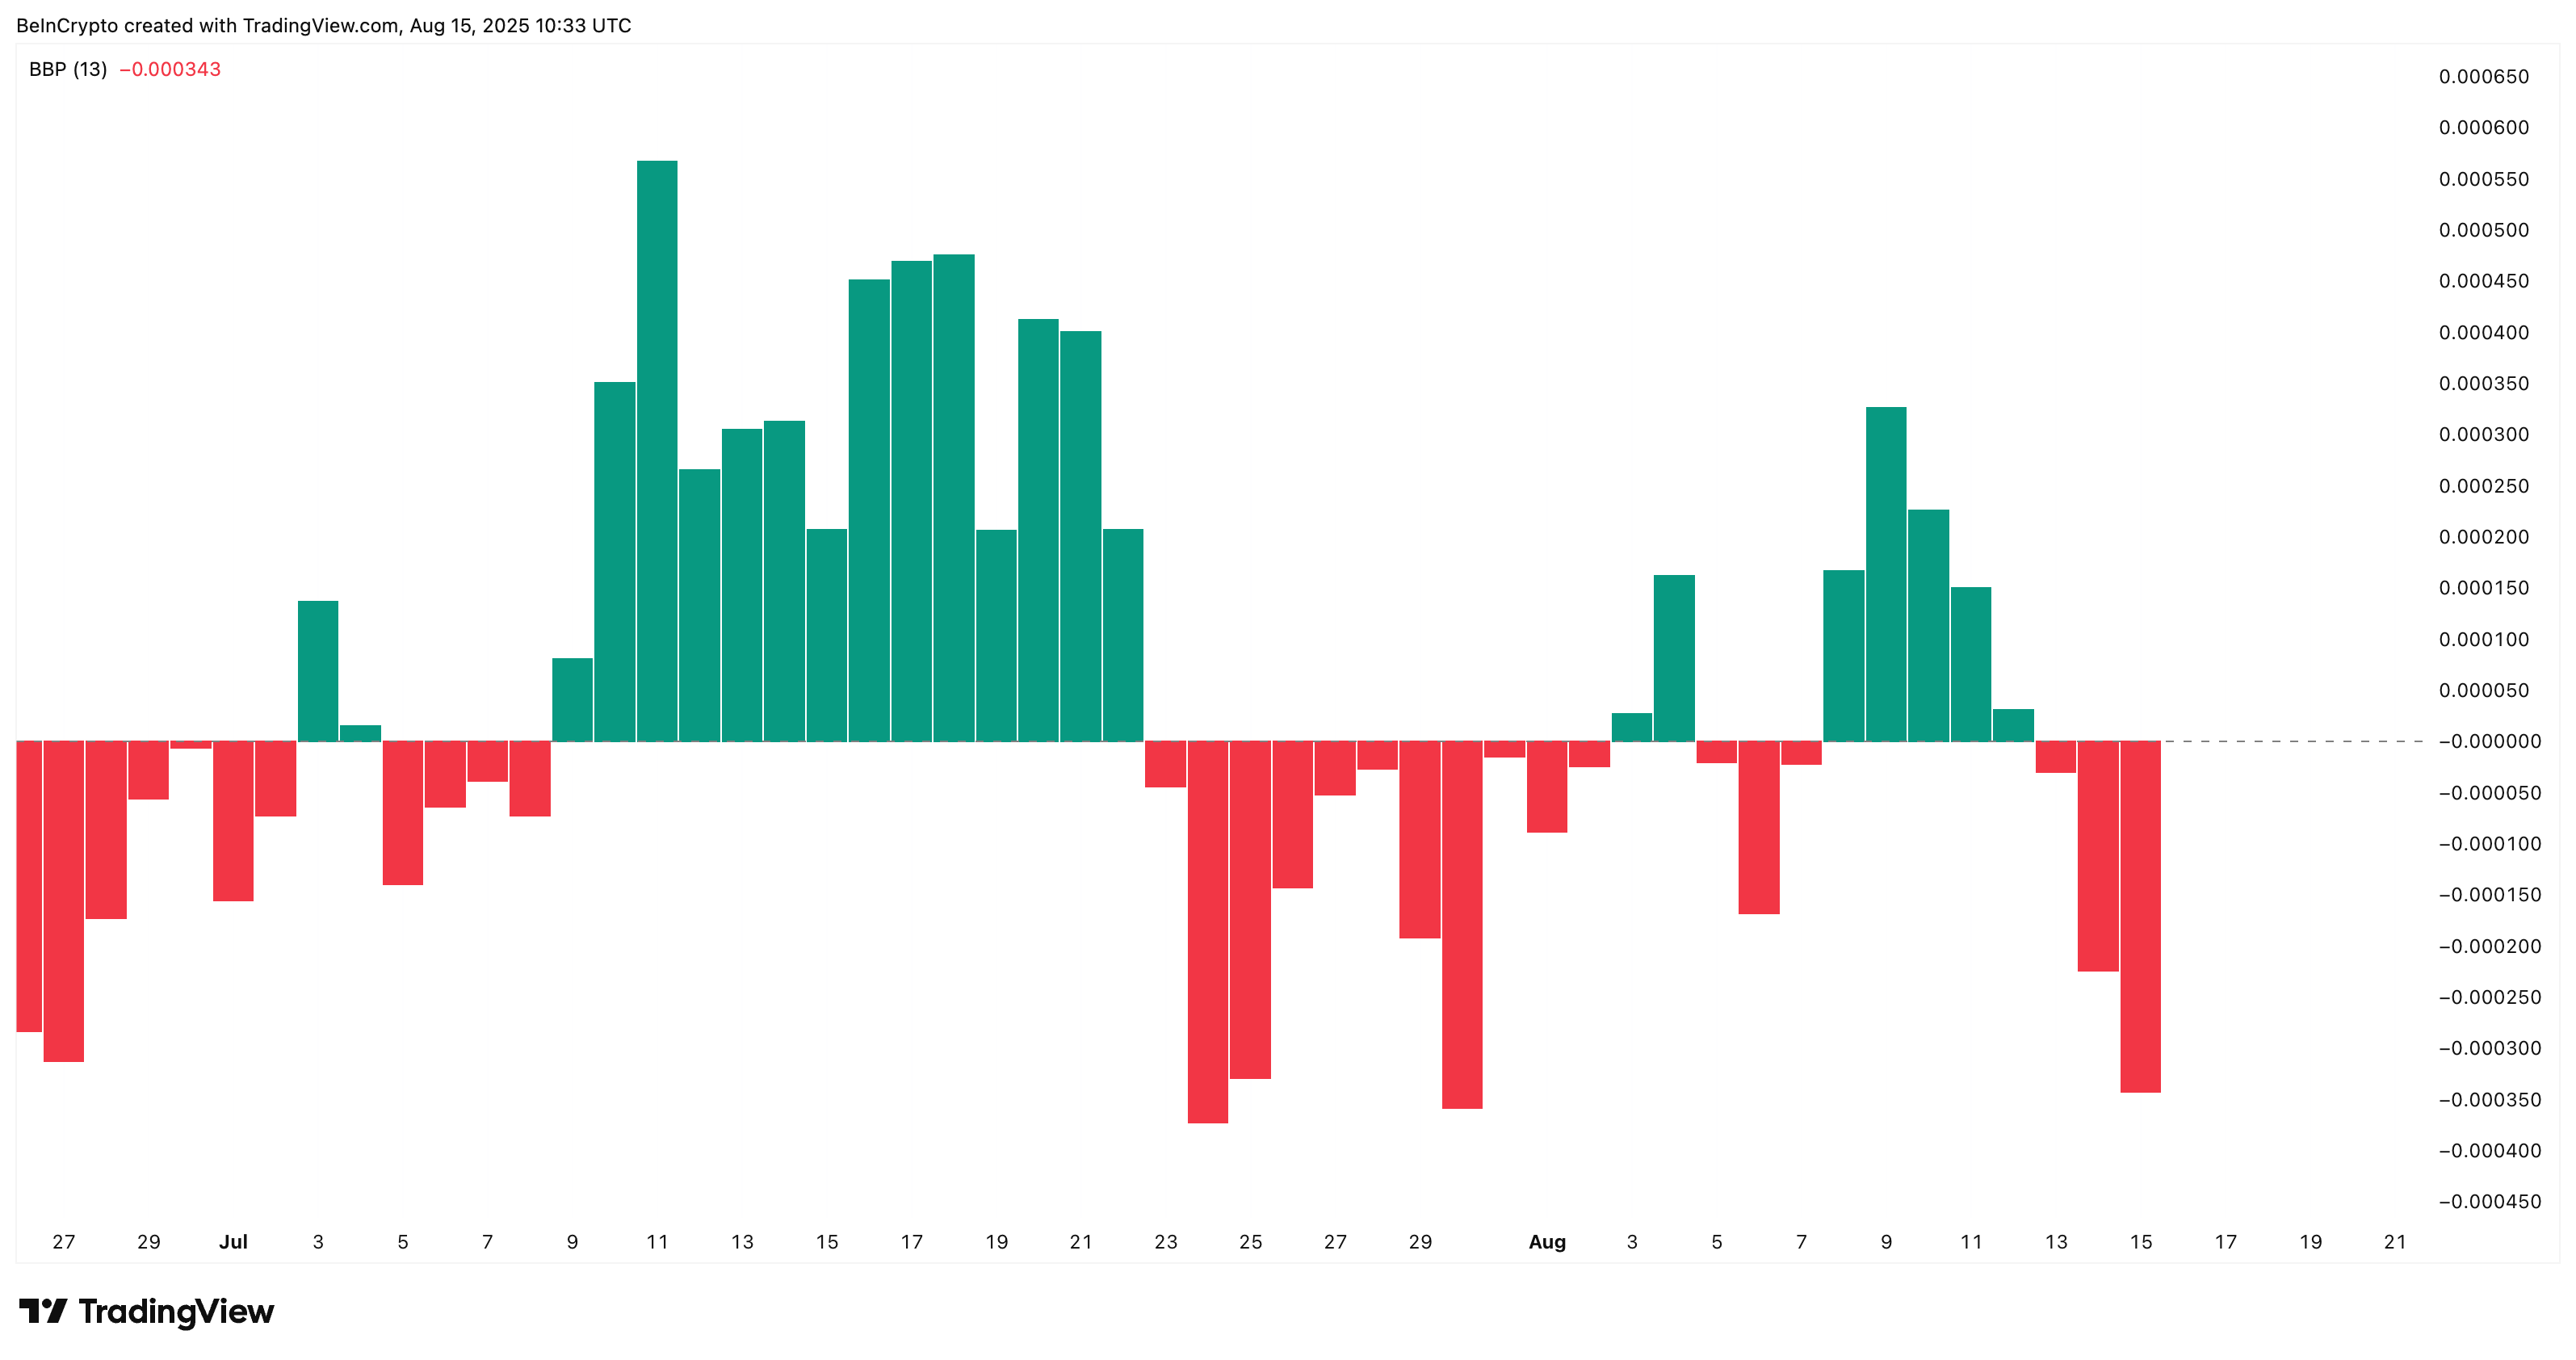
But for now, selling pressure near the lows remains the dominant force, leaving bulls on the defensive. On the daily timeframe, bearish power is also increasing, signaling that sellers are still dictating momentum.
 Bears are gaining control:
The Bull-Bear Power Indicator is a technical analysis tool used to measure buying and selling pressure in the market.
For token TA and market updates: Want more token insights like this? Sign up for Editor Harsh Notariya’s Daily Crypto Newsletter here.
Death Crossover Risk Looms
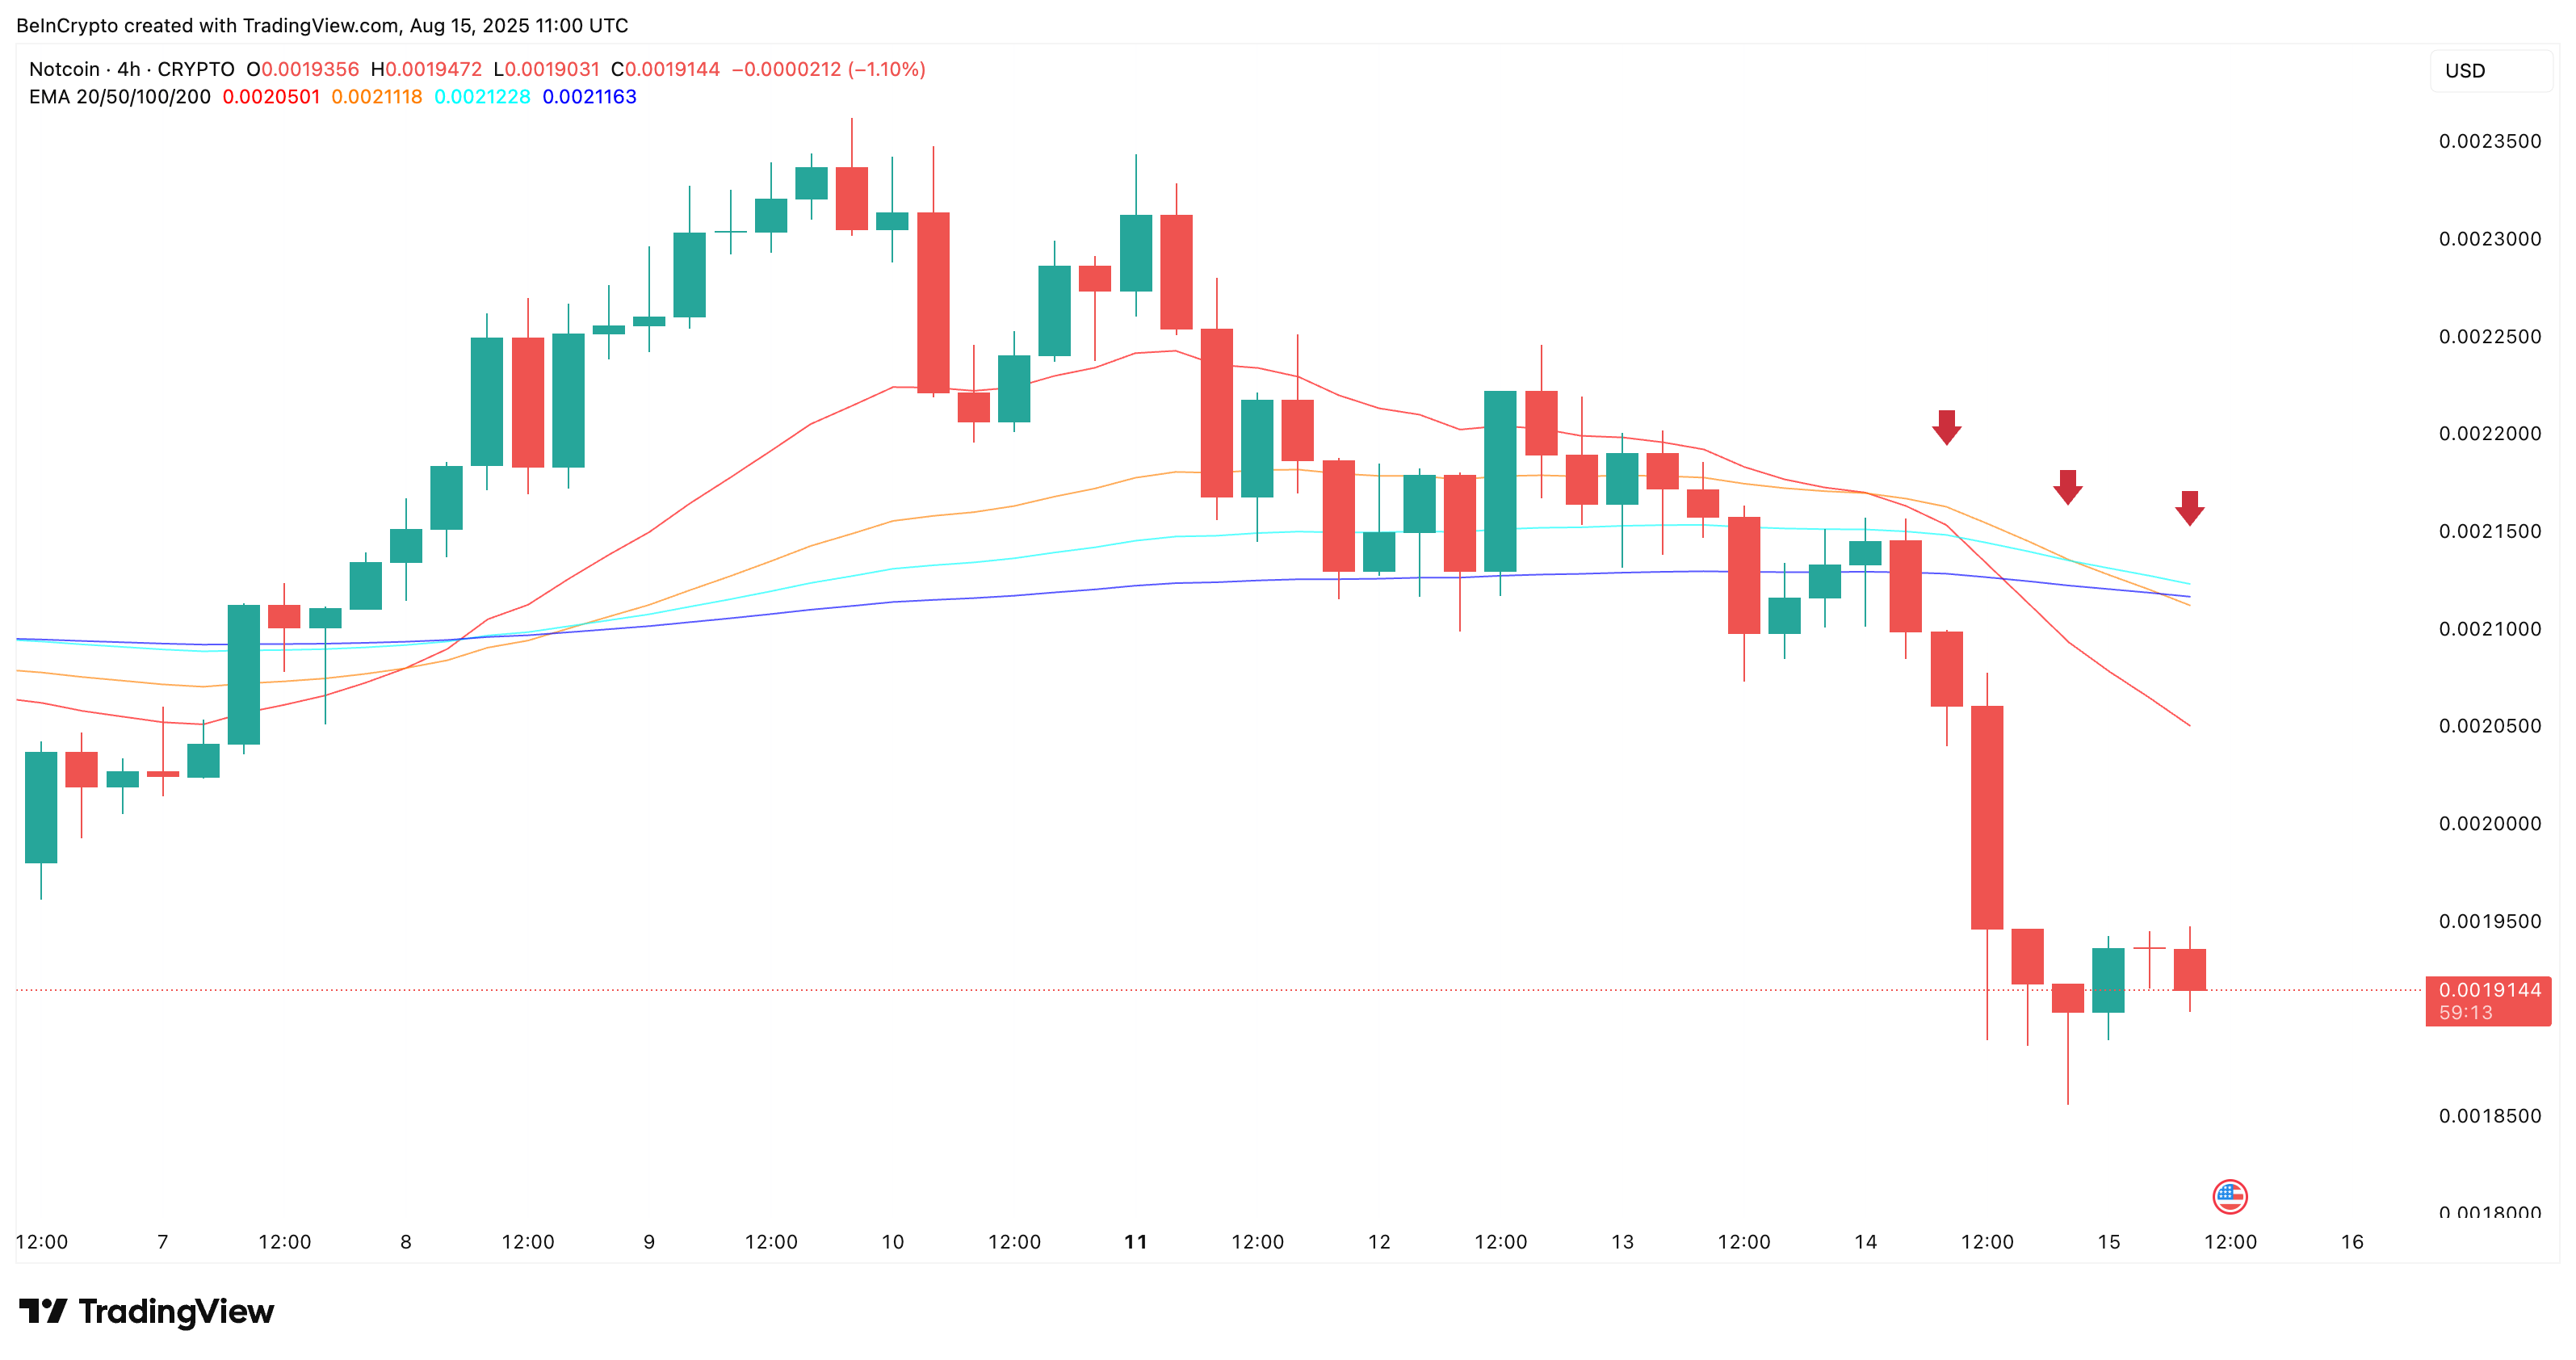
Notcoin’s technical setup is flashing a major red flag. On the 4-hour chart, multiple death crossovers have formed in recent sessions, each marking sharp price drops. The next one is looming — the 100-period EMA or Exponential Moving Average (sky blue line) is closing in on a cross below the 200-period EMA (deep blue line).
 Another death crossover risk looms for the Notcoin price:
If this crossover confirms while exchange inflows remain high, it could accelerate the path toward retesting $0.0018 or setting a fresh all-time low. This chart structure echoes the same bearish momentum seen before earlier declines, reinforcing the short-term risk.
An Exponential Moving Average (EMA) tracks price trends but gives more weight to recent data. A crossover happens when a short-period EMA crosses a long-period EMA. It signals a possible trend change.
One Bullish Divergence Left Standing On The Notcoin Price Chart
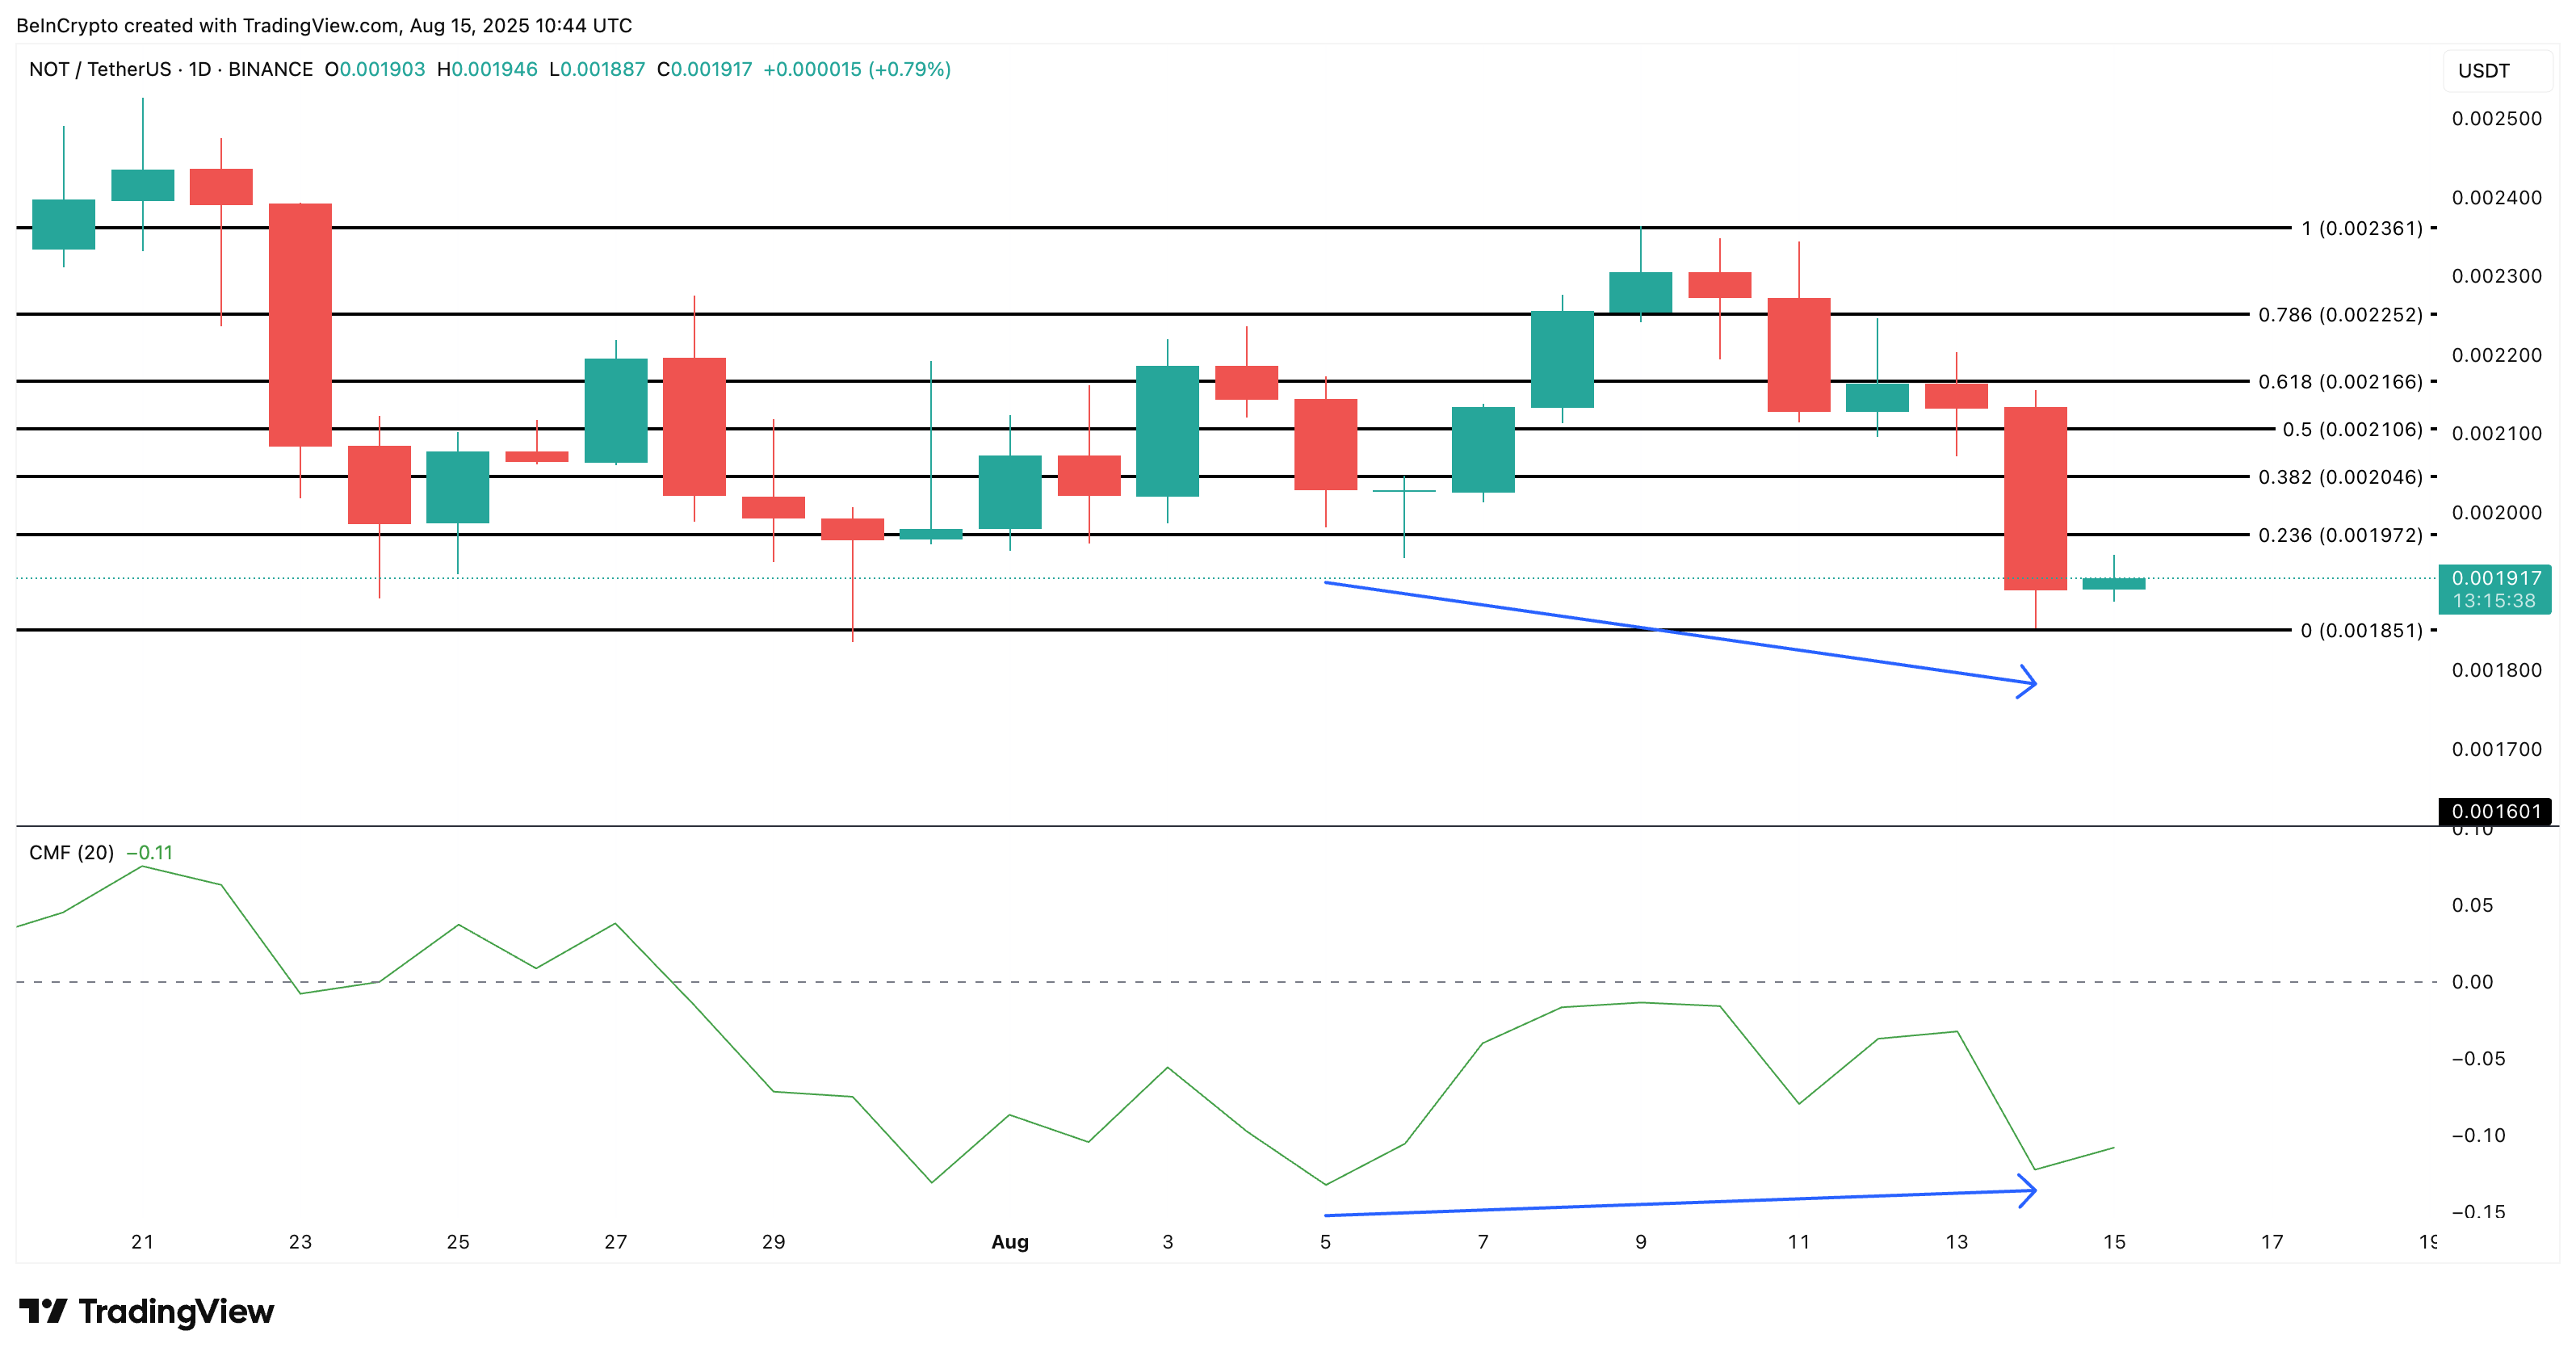
The only constructive sign on the chart comes from the Chaikin Money Flow (CMF). While price made a lower low between August 5 and August 14, CMF printed a higher low — an early sign that selling pressure may be easing.
 Notcoin price analysis:
However, CMF remains in negative territory, meaning the market is still under net selling pressure. For this divergence to matter, CMF would need to break above zero, backed by a visible increase in top 100 address accumulation and a switch to net exchange outflows.
The Chaikin Money Flow (CMF) measures buying and selling pressure using price and volume. A CMF above zero shows buying strength, while below zero shows selling pressure.
If that alignment happens, a bounce toward $0.0019–$0.0020 becomes possible. But until then, a break below $0.0018 remains the more likely outcome, keeping the risk of a new all-time low very much alive. And if that happens, the Notcoin price might end up re-testing the all-time low of $0.0016 or head lower.
Disclaimer: The content of this article solely reflects the author's opinion and does not represent the platform in any capacity. This article is not intended to serve as a reference for making investment decisions.
You may also like
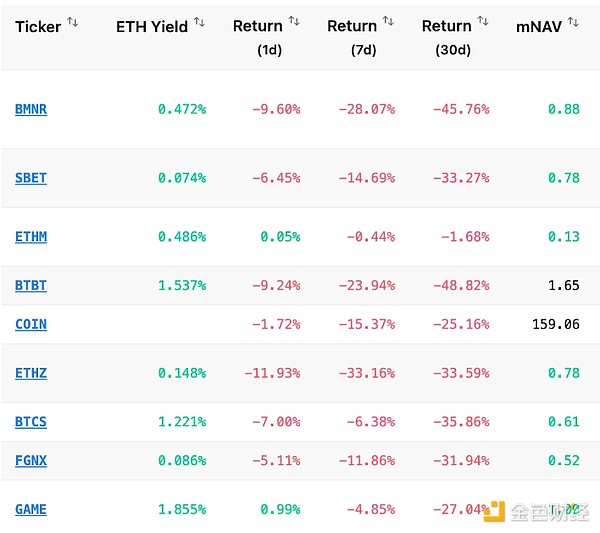
With the market continuing to decline, how are the whales, DAT, and ETFs doing?
The New York Times: $28 Billion in "Black Money" in the Cryptocurrency Industry
As Trump actively promotes cryptocurrencies and the crypto industry gradually enters the mainstream, funds from scammers and various criminal groups are continuously flowing into major cryptocurrency exchanges.

What has happened to El Salvador after canceling bitcoin as legal tender?
A deep dive into how El Salvador is moving towards sovereignty and strength.

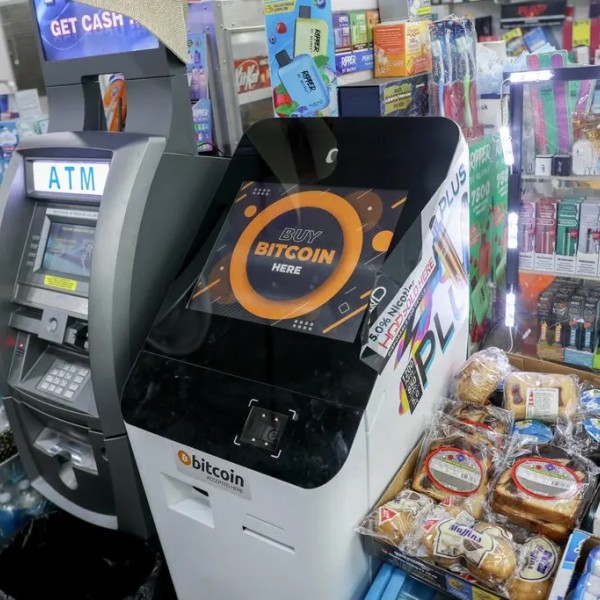
Crypto ATMs become new tools for scams: 28,000 locations across the US, $240 million stolen in six months
In front of cryptocurrency ATMs, elderly people have become precise targets for scammers.