Solana (SOL) Price Prediction for August 21

The Solana market is trading cautiously after last week’s rejection near $200, with bulls trying to stabilize around the $180 handle. Price action shows compression, suggesting a decisive breakout is approaching.
What’s Happening With Solana’s Price?
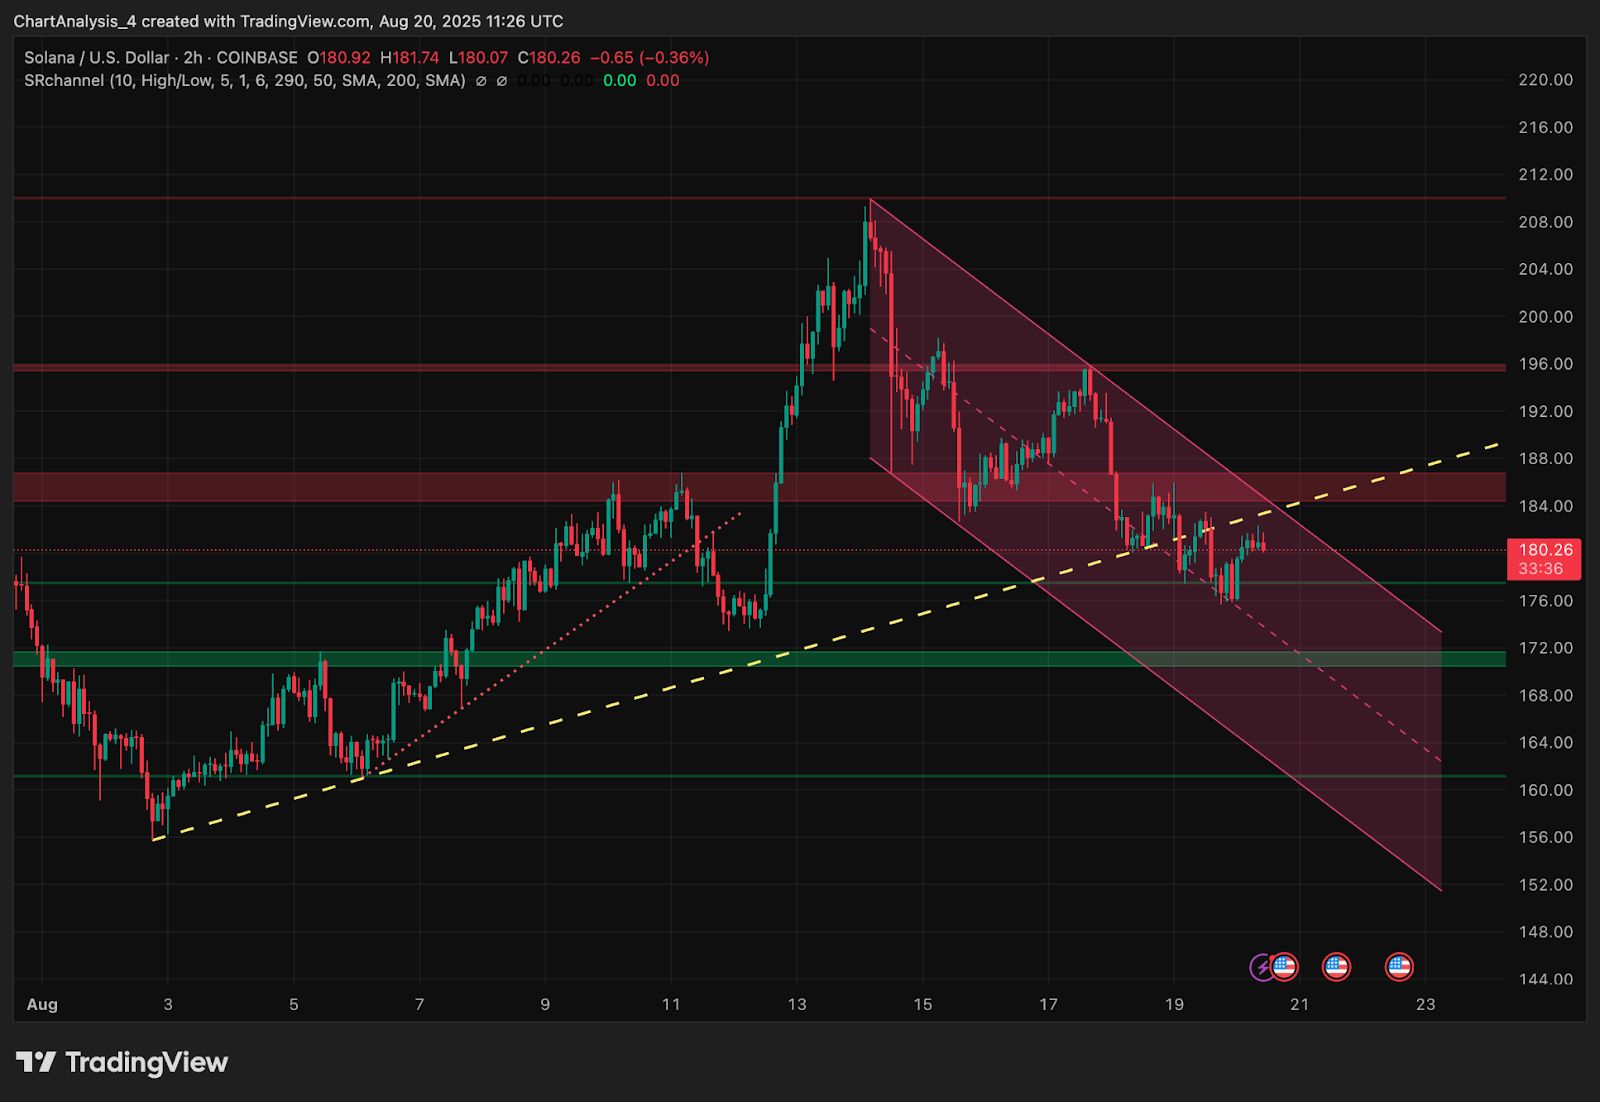
The Solana price today is consolidating around $180.18 after recovering from an intraday low near $176. On the 2-hour chart, SOL remains within a descending parallel channel, struggling to break through the $184–$186 resistance cluster.
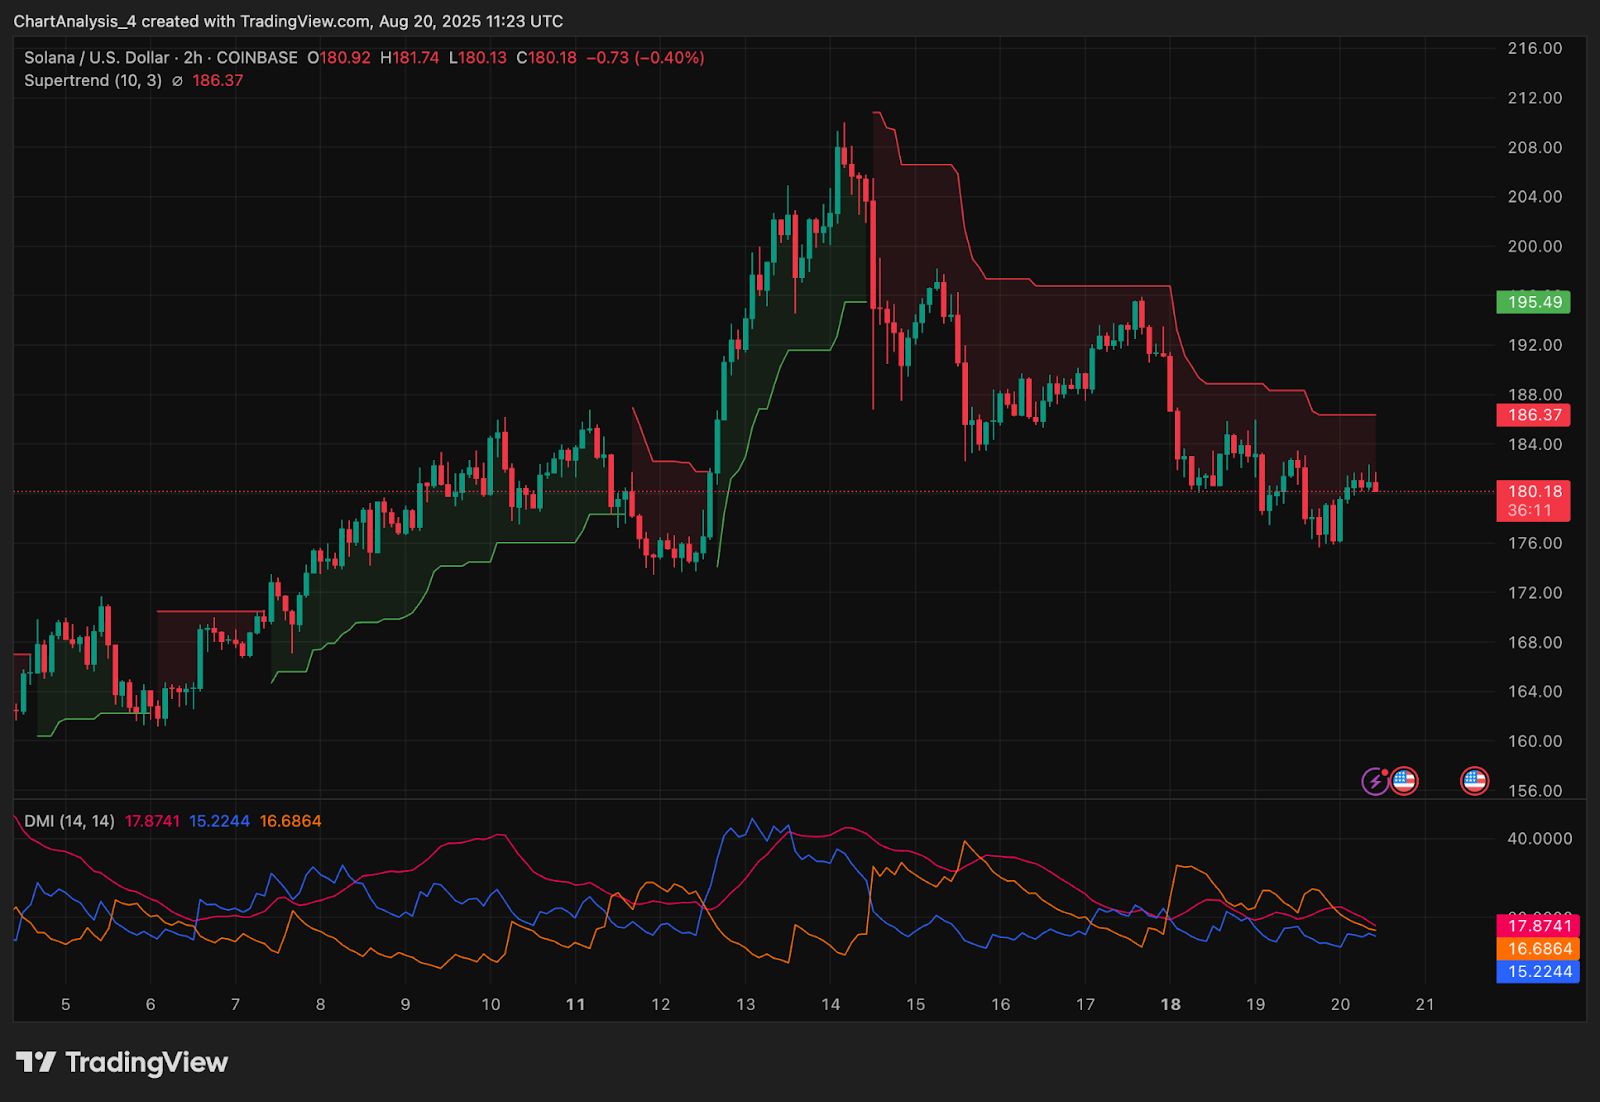
The Supertrend indicator sits overhead at $186.37, reinforcing this level as a key ceiling for bulls. Directional Movement Index (DMI) readings remain weak, with +DI (16.6) and -DI (15.2) showing limited trend strength, while ADX is flat around 17.8, signaling a lack of strong directional conviction. This confirms Solana’s sideways consolidation following the steep decline from its $212 peak earlier in August.
Why Is The Solana Price Going Down Today?
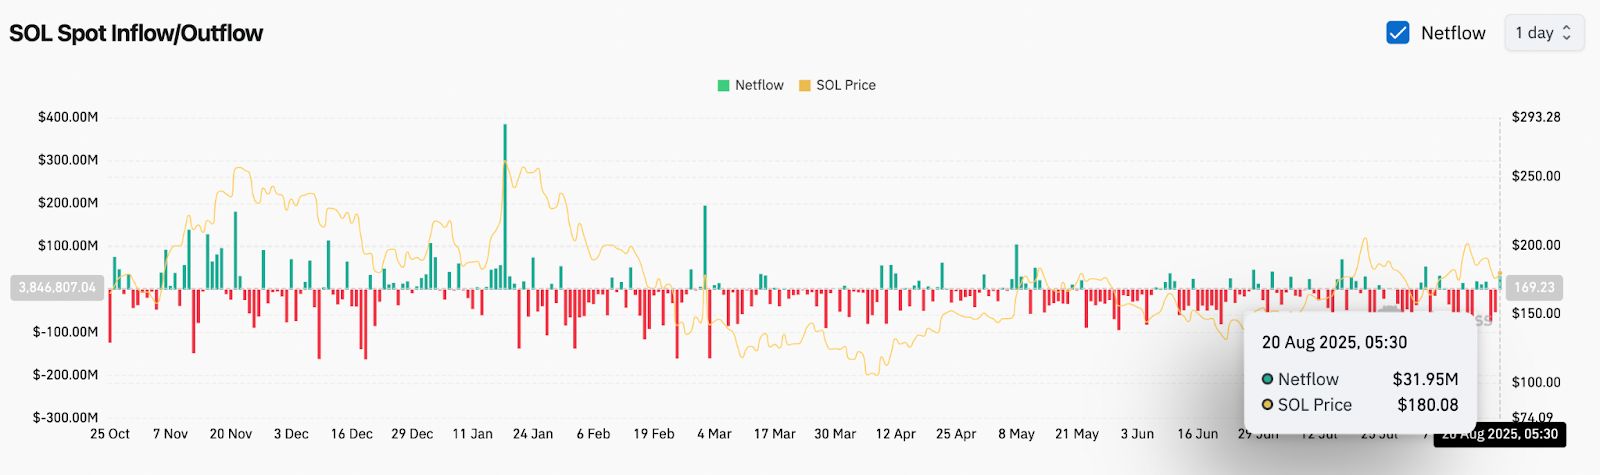
The main reason why Solana price going down today is persistent rejection near $186 and lack of volume support above this zone. On-chain spot flows show net inflows of $31.95M on August 20, but this has not been enough to offset overhead supply.
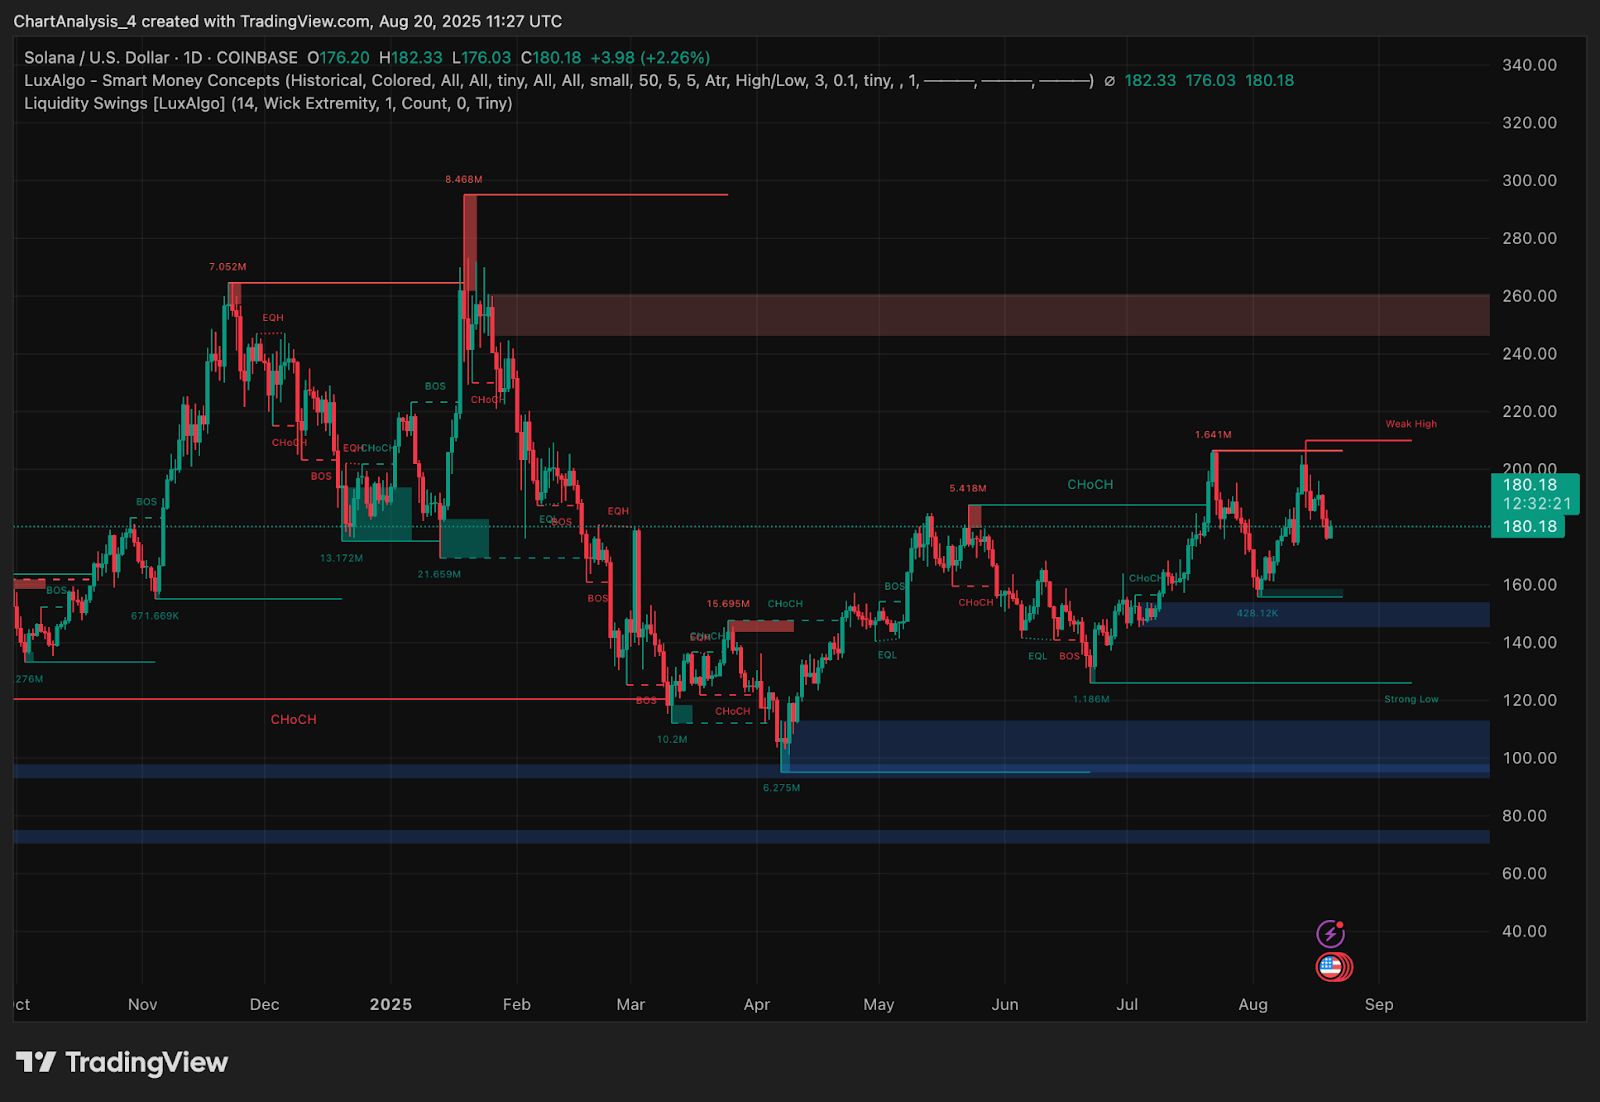
From a Smart Money perspective, the daily chart highlights a recent bearish CHoCH (Change of Character) around $200, with SOL now trading below liquidity clusters that previously served as support. Sellers remain active near $186–$192, aligning with the upper boundary of the descending channel.
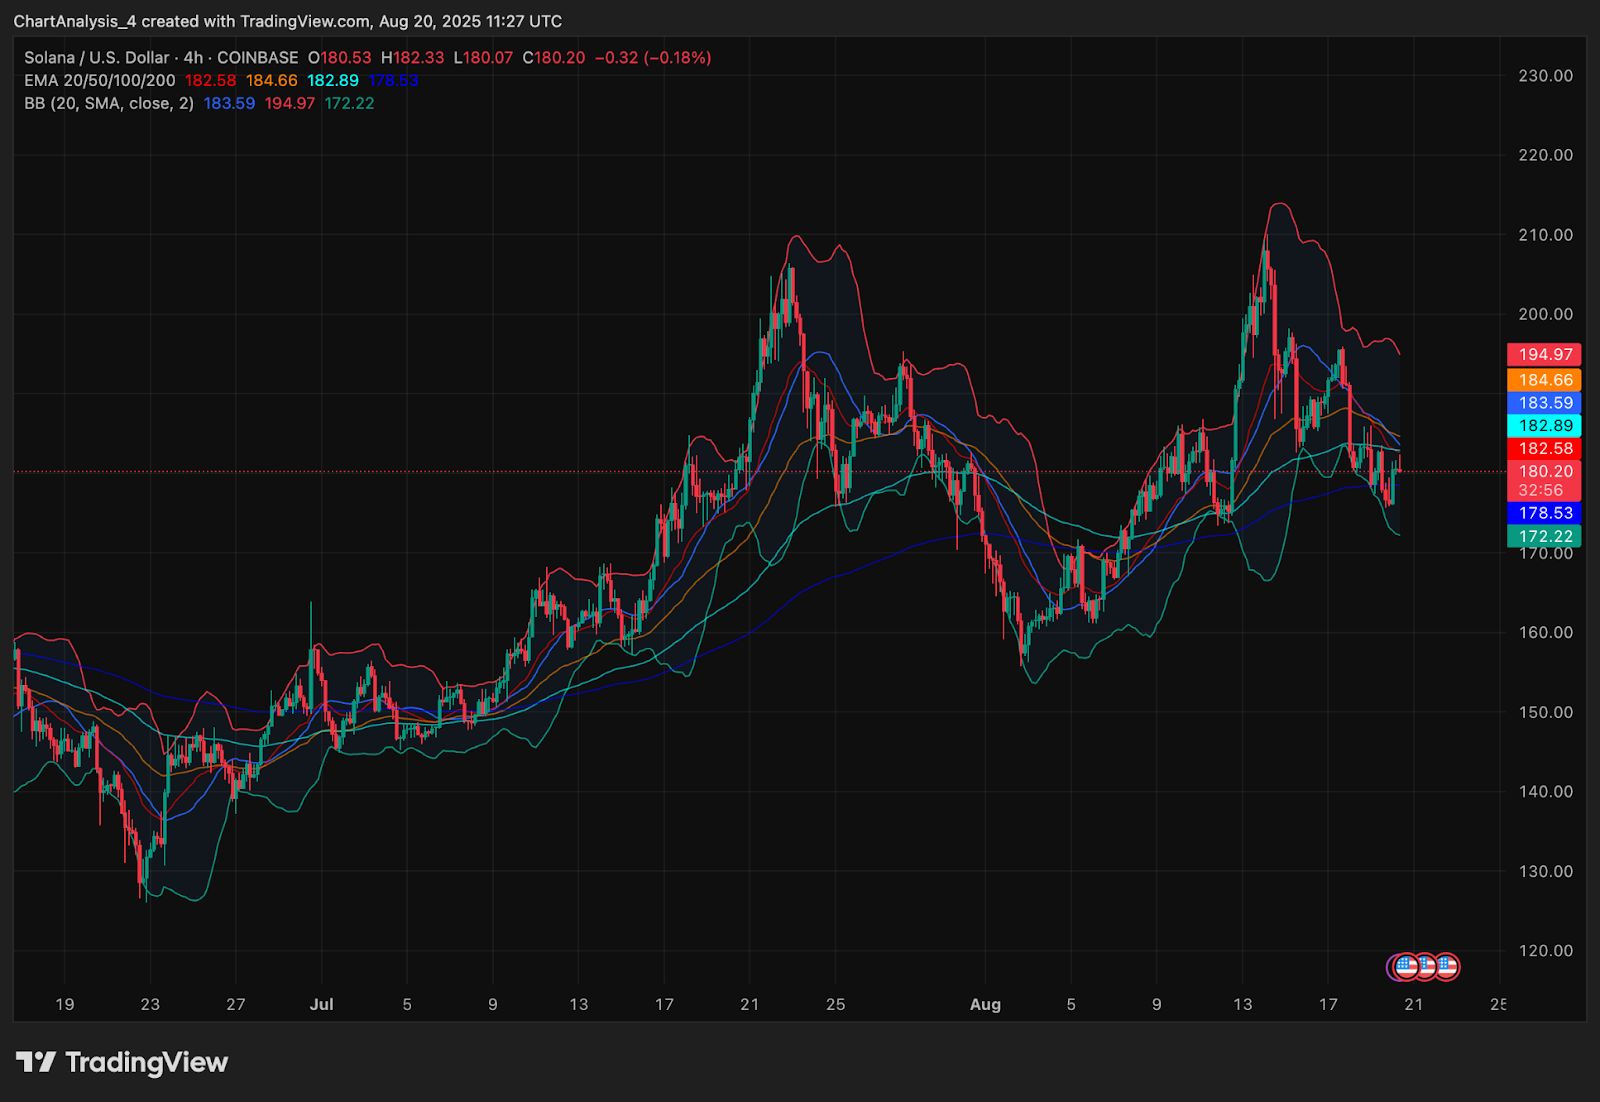
Bollinger Bands on the 4-hour chart show compression between $172 and $195, pointing to reduced volatility. Price is trading just under the mid-band ($183.5) and remains below the EMA20 ($182.5) and EMA50 ($184.6), confirming short-term bearish bias.
Key Indicators Suggest Tight Range Ahead
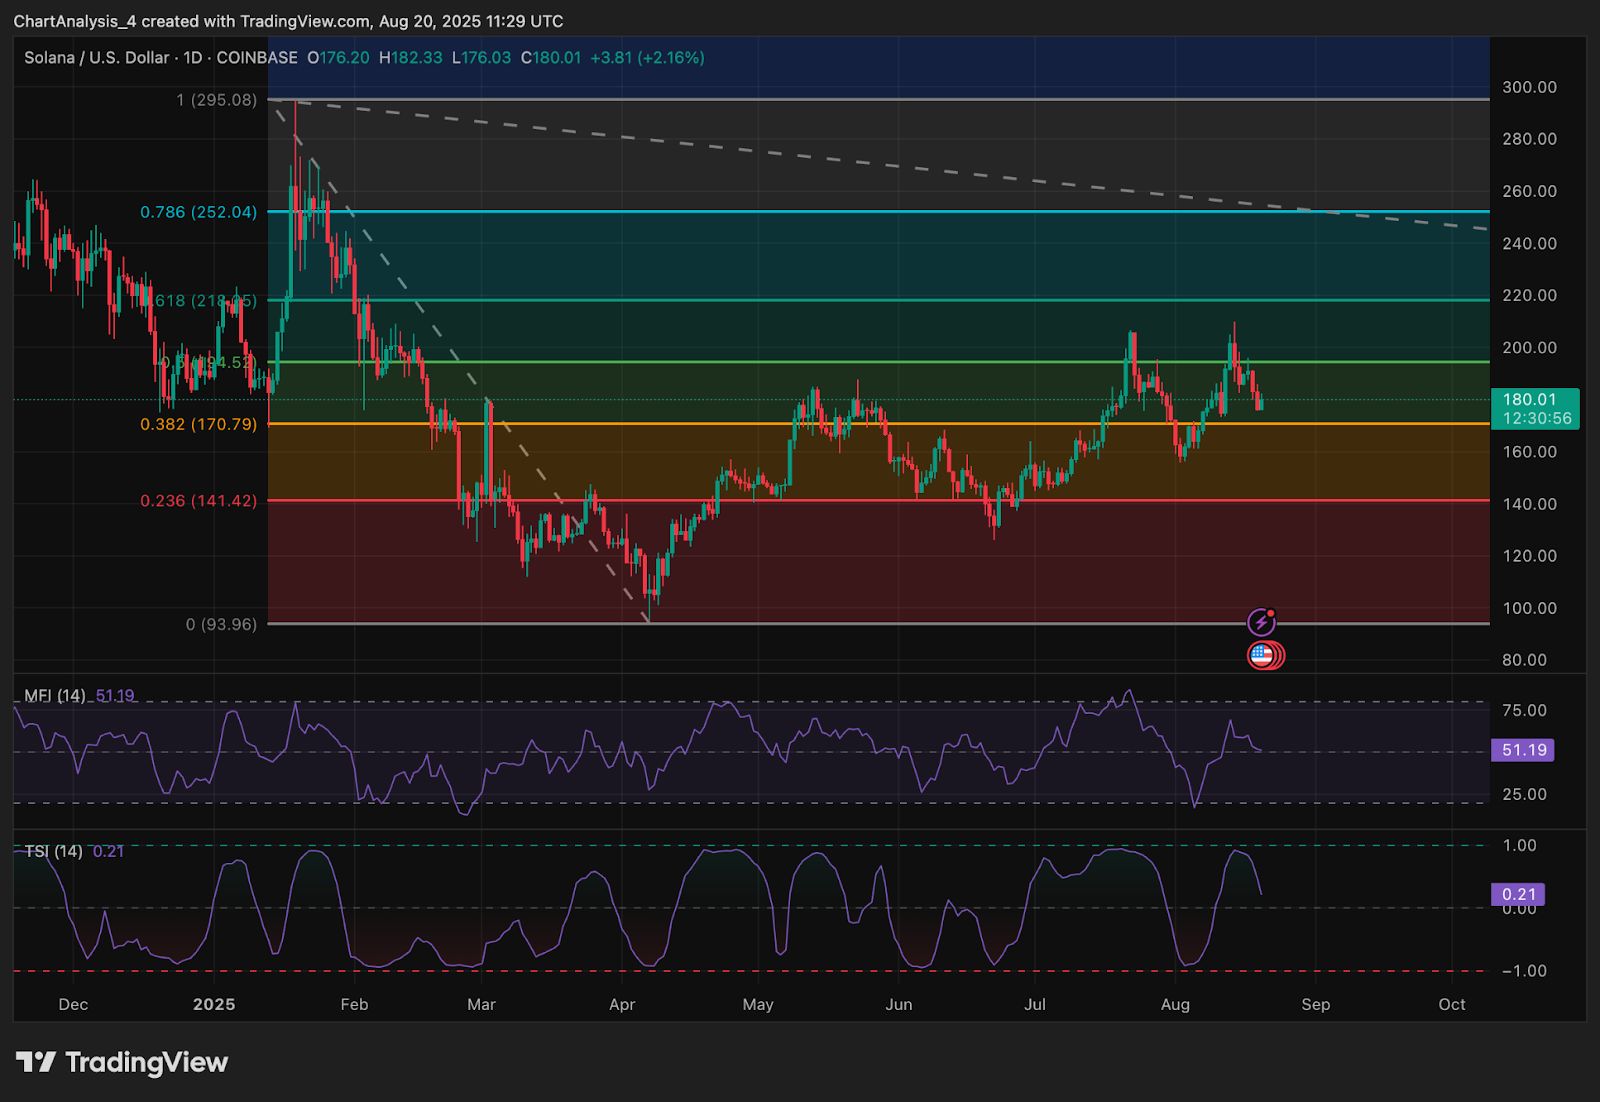
The Fibonacci retracement drawn from the $295 peak to the $93 low shows SOL currently hovering around the 0.382 level ($170.79), which is a critical pivot zone. A decisive daily close below this mark would expose the 0.236 level at $141.4, while holding above could keep momentum alive for a retest of $211 (Fib 0.618).
The RSI on the daily timeframe sits at 51, suggesting neutral momentum, while the True Strength Index (TSI) is flat around 0.21, lacking a clear bullish or bearish crossover. Meanwhile, the Money Flow Index (MFI) is at 51, reflecting balanced liquidity inflows and outflows.
SOL Price Prediction: Short-Term Outlook (24H)
In the immediate term, Solana price action is likely to remain capped under $186 unless bulls reclaim this zone with volume confirmation. A clean breakout could trigger upside toward $195.4 and the broader $200 resistance, which marks a critical decision point for trend reversal.
On the downside, failure to sustain above $176 risks a drop toward $170.7, with deeper support sitting near $162. A channel breakdown could even extend losses toward $152 in extreme bearish conditions.
With indicators neutral and volatility compressing, the next 24 hours will likely see Solana trade in a tight range, with $176–$186 as the critical battle zone.
Solana Price Forecast Table: August 21, 2025
| Indicator/Zone | Level / Signal |
| Solana price today | $180.18 |
| Resistance 1 | $186.3 (Supertrend / Channel) |
| Resistance 2 | $195.4 |
| Support 1 | $176.0 |
| Support 2 | $170.7 (Fib 0.382) |
| EMA20 / EMA50 (4H) | $182.5 / $184.6 (Bearish stack) |
| RSI (Daily) | 51.1 (Neutral) |
| TSI (Daily) | 0.21 (Flat momentum) |
| MFI (Daily) | 51.2 (Balanced flows) |
| Spot Netflow (Aug 20) | +$31.95M (mild inflow) |
| Channel Bias (2H) | Bearish until >$186 |
Disclaimer: The information presented in this article is for informational and educational purposes only. The article does not constitute financial advice or advice of any kind. Coin Edition is not responsible for any losses incurred as a result of the utilization of content, products, or services mentioned. Readers are advised to exercise caution before taking any action related to the company.
Disclaimer: The content of this article solely reflects the author's opinion and does not represent the platform in any capacity. This article is not intended to serve as a reference for making investment decisions.
You may also like
Crypto: The Fear Index Drops to 10, But Analysts See a Reversal

Uniswap Labs Faces Pushback as Aave Founder Highlights DAO Centralization Concerns

Ethereum Interop Roadmap: How to Unlock the “Last Mile” for Mass Adoption
From cross-chain to "interoperability," many of Ethereum's fundamental infrastructures are accelerating towards system integration for large-scale adoption.

A $170 million buyback and AI features still fail to hide the decline; Pump.fun is trapped in the Meme cycle
Facing a complex market environment and internal challenges, can this Meme flagship really make a comeback?