XRP price outlook: XRP is trading near $2.86 after breaking its rising trendline, showing short-term weakness, but an RSI just below 40 and falling volume suggest a possible relief rally if buyers reassert pressure above $2.95–$3.00.
-
XRP: short-term weakness near $2.86; RSI under 40 suggests approaching oversold levels
-
Bitcoin: bearish RSI divergence and break below the 50-day EMA warn of higher downside risk toward the 200-day EMA
-
Ethereum: controlled correction, support at $4,200; momentum could push toward $5,000 if volume and buyers return
XRP price outlook: technicals show short-term weakness near $2.86 but RSI signals a possible relief rally — read full analysis and action points.
What is the XRP price outlook?
XRP price outlook: XRP’s price action shows a loss of short-term momentum after dropping below a rising trendline and trading around $2.86. The RSI below 40 signals the approach of oversold conditions, while a recovery above $2.95–$3.00 and rising volume would be required to restore the uptrend.
How should traders read XRP’s indicators?
RSI and moving averages give the clearest short-term signals. The Relative Strength Index under 40 often precedes relief rallies in XRP cycles. The 50-day EMA sits just below current levels; a close below the 50-day risks a move toward the 100-day EMA at $2.74.
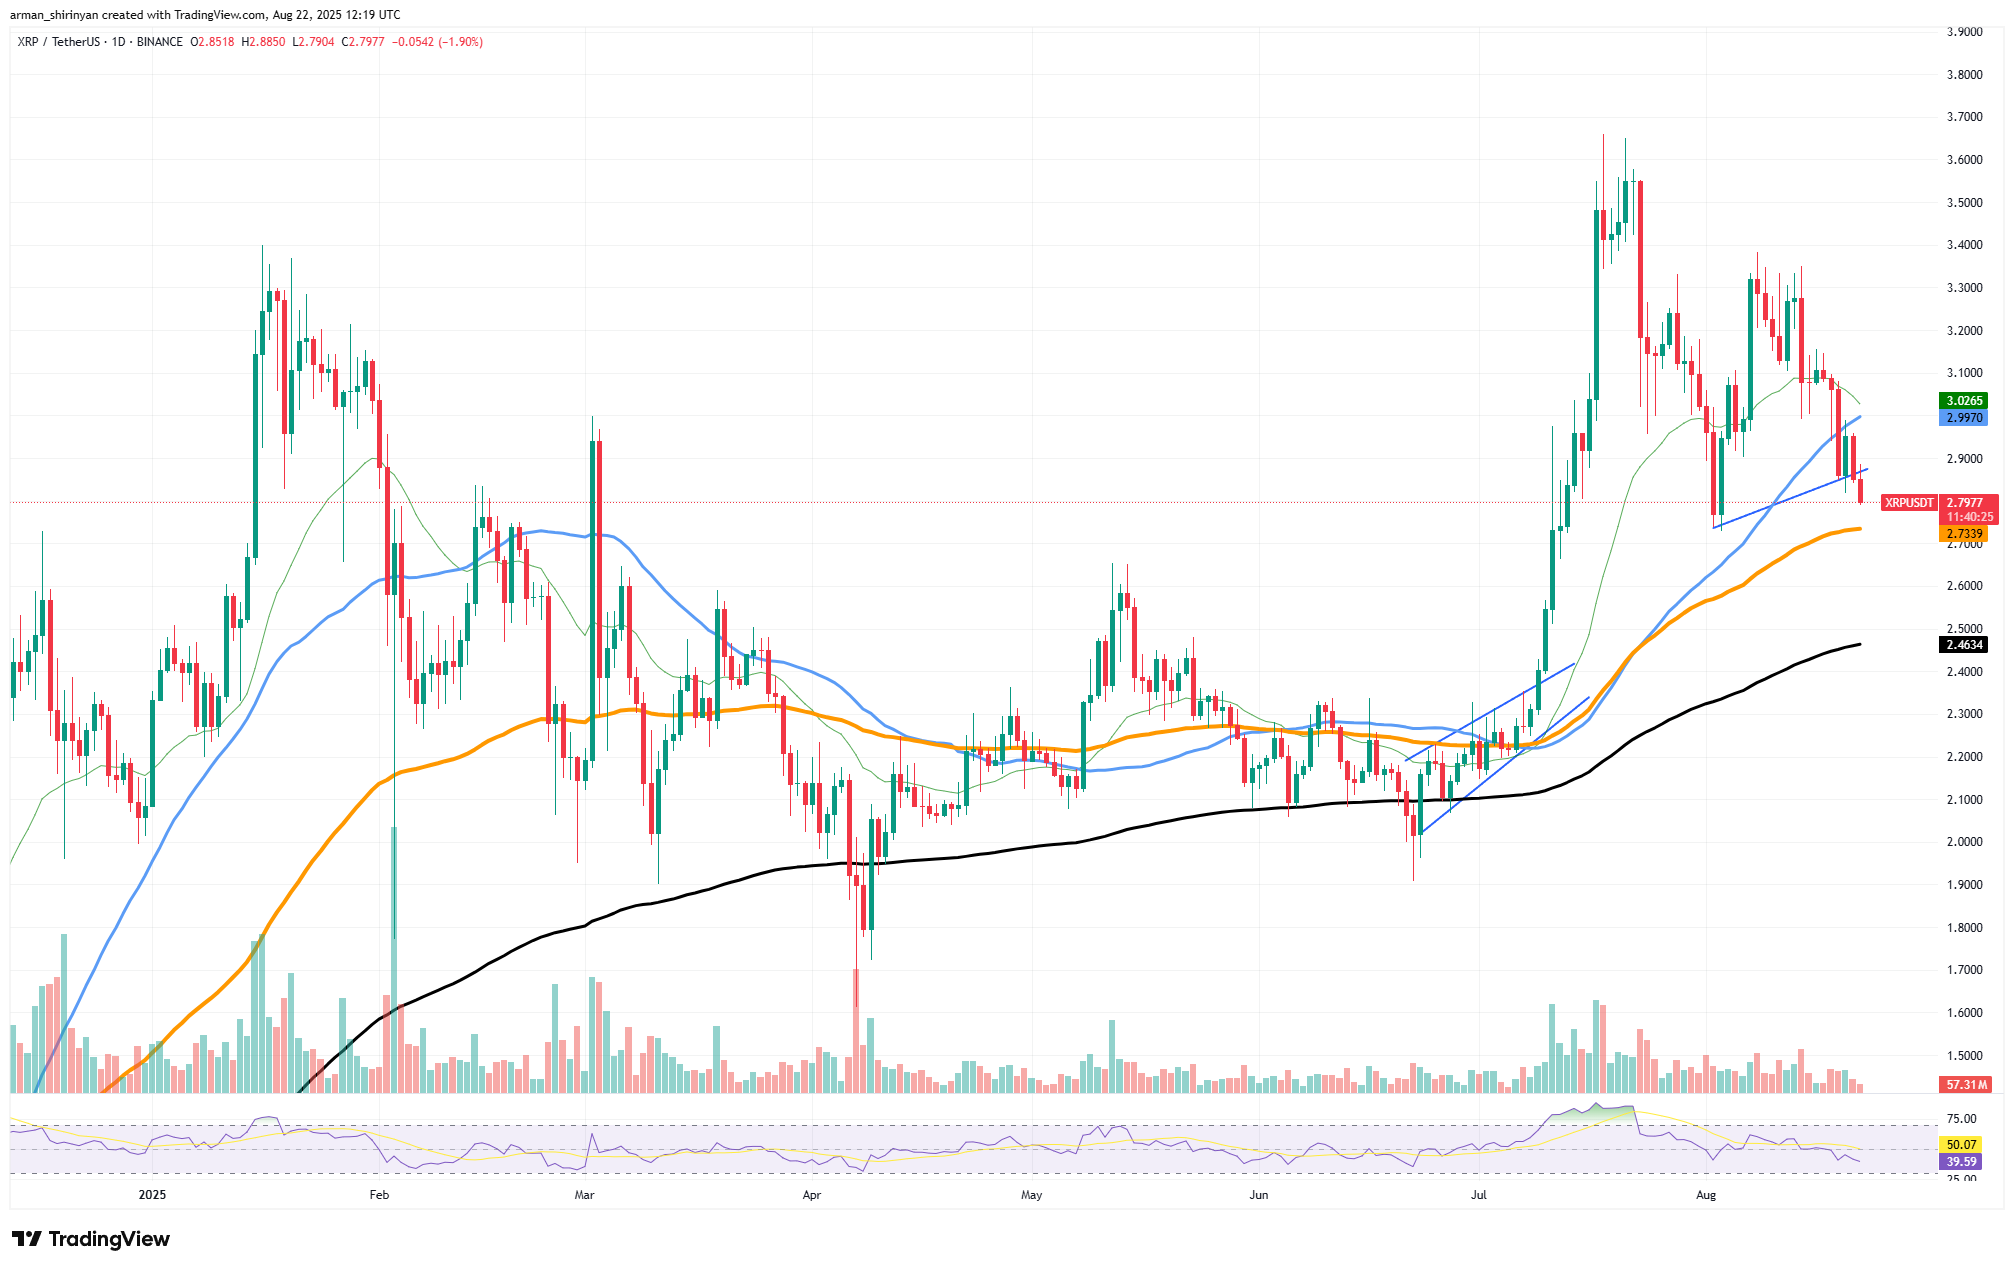
XRP/USDT Chart by TradingView
Trading volume has declined, which reduces the conviction behind the recent sell-off. Lower volume means a smaller amount of buying could reverse momentum. A sustainable recovery requires volume to expand above short-term averages as price moves back through the $2.95–$3.00 zone.
Why is Bitcoin showing divergence?
Bitcoin exhibits a pronounced bearish RSI divergence and has recently broken below its 50-day EMA, undermining short-term momentum. Historically, similar divergences preceded extended corrections, making current structure a risk for further downside.
Declining trading volume during the retracement adds to the bearish case. Bitcoin is trading just above the 100-day EMA (noted here as an important technical reference). If buyers fail to re-emerge, the 200-day EMA could act as the next major support level.
Which levels matter for Bitcoin now?
Key technical thresholds: the 50-day EMA (recently broken), the 100-day EMA near current price, and the 200-day EMA as the deeper support zone. RSI under 40 would strengthen bearish conviction and increase the likelihood of a move toward longer-term EMAs.
How resilient is Ethereum and what are the odds of $5,000?
Ethereum outlook: Ethereum’s recent correction was orderly, holding above the 26-day EMA and support near $4,200. Volume patterns show waning seller participation and a normalization of RSI after overbought readings, suggesting base formation rather than collapse.
If Ethereum maintains support above $4,200 and buyers reappear, a retest of $4,800 is likely and a breakout could open a path toward the $5,000 psychological level. This scenario depends on renewed volume and sustained buying interest.
What technical signs confirm ETH strength?
Look for higher lows on intraday charts, expanding volume on advances, and RSI moving off consolidation ranges. A clean close above $4,800 with volume would materially increase odds for a move toward $5,000.
Comparative key levels
| XRP | $2.74 (100-day EMA) | $2.95–$3.00 (reclaim to resume uptrend) | Neutral-bearish |
| Bitcoin | 100-day EMA (near current) | 200-day EMA (deeper support) | Bearish risk |
| Ethereum | $4,200 (short-term support) | $4,800 resistance / $5,000 target | Neutral-bullish |
Frequently Asked Questions
Is XRP oversold and ready to rebound?
RSI just below 40 suggests XRP is approaching oversold territory. A rebound is possible if volume increases and price clears $2.95–$3.00, but confirmation requires sustained buying above the 50-day EMA.
Should traders be worried about Bitcoin’s divergence?
Bearish RSI divergence and a break below the 50-day EMA are cautionary signs. Traders should watch the 100- and 200-day EMAs and monitor volume for confirmation of either recovery or deeper correction.
Will Ethereum reach $5,000 soon?
Ethereum’s charts show a controlled correction and potential to retest $4,800. A move to $5,000 is feasible if support at $4,200 holds and buying volume accelerates, but it is not guaranteed.
Key Takeaways
- XRP technicals: Short-term weakness but RSI suggests possible relief; reclaiming $2.95–$3.00 is critical.
- Bitcoin risk: Bearish RSI divergence and 50-day EMA breach increase downside risk toward longer-term EMAs.
- Ethereum outlook: Controlled consolidation; holding $4,200 and rising volume would support a $5,000 scenario.
Conclusion
Market structure shows divergent signals across major cryptocurrencies: XRP is vulnerable but not capitulated, Bitcoin faces elevated downside risk, and Ethereum appears to be consolidating for a potential leg higher. Monitor RSI, EMA levels, and volume for clear trade signals. COINOTAG will continue to track updates and provide evidence-based analysis.