Bitcoin News Today: Bitcoin's Breaking Support Levels Signal Deepening Bearish Control
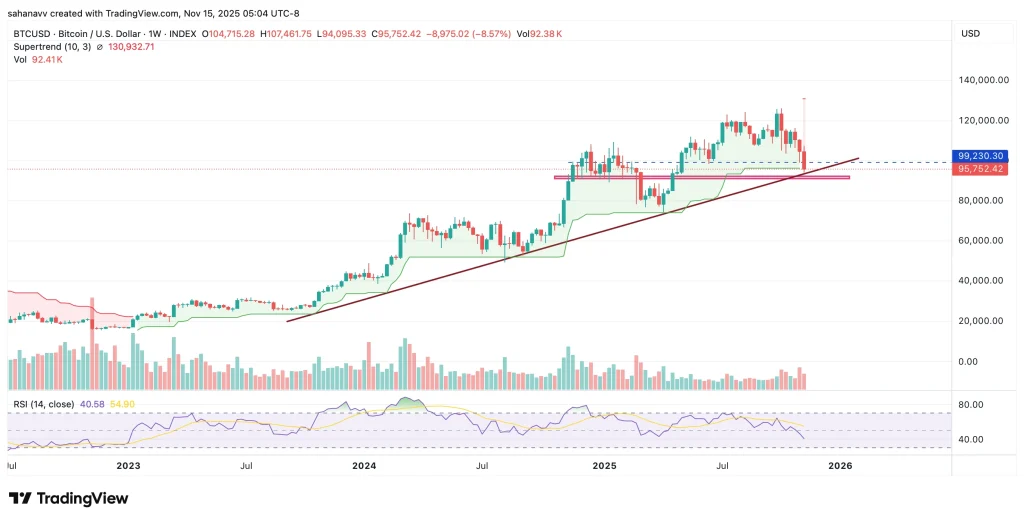
- Bitcoin's price fell below $112,000 support, confirming bear flag breakdown and strengthening bearish momentum on four-hour charts. - Technical indicators show RSI below midline and $114,000 as critical resistance, with failure to hold risking deeper correction toward $100,000. - On-chain data reveals negative 30-day exchange netflow, indicating long-term holders accumulate Bitcoin while sellers dominate short-term trading. - Liquidation clusters below $104,000 suggest potential price absorption, but wee
Bitcoin's price dynamics have drawn significant attention from traders and analysts as the cryptocurrency struggles to maintain key resistance levels. Recent price action has highlighted the importance of a weekly close above $114,000 for Bitcoin to avoid a more severe correction and to reaffirm the strength of the bullish trend. Failure to hold above $112,000, a critical support level, has already signaled a bear flag breakdown on the four-hour chart, suggesting that the bearish momentum is gaining traction.
Bitcoin has experienced a steady decline since reaching its all-time high of $124,500 on August 14, with a 11% drawdown reported over the past three weeks. A long wick below $109,000 indicates significant buying pressure at this level, yet the price remains unable to flip this into support. Analysts like Rekt Capital emphasize that turning $114,000 into new resistance would prolong the current pullback, potentially leading to a deeper correction across the market.
On-chain data further supports the bearish narrative. Over the last 30 days, exchange netflow has remained consistently negative, indicating that more Bitcoin is being moved off exchanges than deposited. This trend suggests that long-term holders are accumulating rather than preparing to sell, reinforcing a potential supply squeeze. While there have been intermittent large inflows into exchanges, these have been offset by equally strong outflows, maintaining the broader accumulation trend. This behavior is consistent with a bear market where investors prefer to hold rather than trade, despite short-term volatility.
The four-hour chart reveals a continuation of bearish momentum, with the price dropping below the key $112,000 support level. A bear flag pattern has been validated as sellers take control, with the measured move target pointing toward a potential decline to $103,700. The relative strength index (RSI) remains below the midline, further confirming the dominance of bearish pressure. In this context, if Bitcoin falls below the $104,000 level, the next critical support is near $100,000, where a breach could trigger a sharper decline in the coming weeks.
Liquidation data also shows clusters of bids all the way down to $104,000, indicating that liquidity at this level could absorb a significant portion of the selling pressure. However, this also means that the price could continue to drop to meet this liquidity before finding a floor. The market’s current configuration suggests that a weekly close below $110,000 could mark a turning point, shifting the momentum decisively in favor of bears and potentially dragging the price toward $100,000 or lower.
Bitcoin's path forward remains highly dependent on short-term technicals and investor sentiment. With the price showing signs of exhaustion and key levels being tested, the coming days will be crucial for determining the direction of the broader market. Analysts remain divided on the likelihood of a rebound, but all agree that the immediate risk is to the downside, with the potential for a bearish trend extending beyond the near term.
Source:

Disclaimer: The content of this article solely reflects the author's opinion and does not represent the platform in any capacity. This article is not intended to serve as a reference for making investment decisions.
You may also like
Saylor Dismisses Sell-Off Rumors as Strategy Increases Bitcoin Holdings Amid Market Drop

Coinpedia Digest: This Week’s Crypto News Highlights | 15th November, 2025
Cathie Wood’s ARK Invest Buys Circle, BitMine, and Bullish Shares Amid Market Dip
Bitcoin Heads Into Weekend Under Pressure as Price Tests Key Support Levels