Ethereum price trades near $4,475, with immediate resistance at $4,500 and key support at $4,362–$4,200; a decisive break above $4,500 would signal bullish continuation, while a drop below $4,200 risks a deeper retracement toward $3,600–$3,400.
-
Breakout above $4,500 flips short-term bias bullish
-
Support band $4,362–$4,200 must hold to sustain accumulation
-
Failure below $4,200 could target $3,600–$3,400 accumulation zone
Ethereum price near $4,475; watch $4,500 resistance and $4,362 support for the next move — read analysis and act with risk controls.
What is the current Ethereum price outlook?
Ethereum price is trading around $4,475 in a narrow range between key Fibonacci retracements, with immediate resistance near $4,500 and critical support at $4,362–$4,200. A clear breakout or breakdown from this band will likely determine the next directional leg for ETH.
How are Fibonacci levels shaping ETH’s short-term trend?
Fibonacci retracement levels are anchoring price expectations: the 0.618 at $4,381 and the 0.5 at $4,486 define a tight battleground. A push above the 0.5 level and the descending trendline would target the 0.382 ($4,593) and 0.236 ($4,729) levels. These zones are used by traders to set stop-losses and profit targets.
Why does $4,500 matter for ETH?
Analyst Ali notes that a clear move above $4,500 would reclaim the 0.5 Fibonacci retracement and the descending trendline, which together act as a technical breakout trigger. Clearing this zone could unlock further upside through $4,593 and $4,729 toward prior highs.
Ethereum trades near $4,475 as analysts note $4,500 resistance and $4,362 support as key levels for the next major move.
- Analyst Ali says Ethereum must break $4,500 to flip bullish, with next resistance targets at $4,593 and $4,729.
- RJT WAGMI notes Ethereum must hold above $4,362–$4,200 support to sustain bullish momentum toward $4,889 and beyond.
- Failure to defend $4,200 support could drag Ethereum toward the $3,600–$3,400 accumulation zone in a deeper retracement.
Ethereum is trading at $4,475, between key Fibonacci levels that could determine its next major move. The asset sits slightly above the 0.618 retracement support at $4,381.93 and just below the 0.5 retracement at $4,486.44.
Analysts describe this narrow range as a decisive battleground for short-term momentum. A sustained rejection of resistance risks deeper downside; conversely, a breakout could shift the trend back to bullish in the short term.
How strong are current support zones for Ethereum?
Immediate support centers on the 0.618 Fibonacci at $4,382, with the 0.786 retracement around $4,237. Below those levels, technical extensions point to $4,060 and then the $3,845 region. RJT WAGMI highlights the $4,362–$4,200 band as a consolidation base that must hold for buyers to maintain control.
What upside targets are realistic if support holds?
If ETH sustains above $4,362, accumulation could lift prices toward $4,889.47, with an extended breakout potentially pushing toward $5,200–$5,500. Traders should watch volume confirmation and the strength of the breakout to validate continuation.
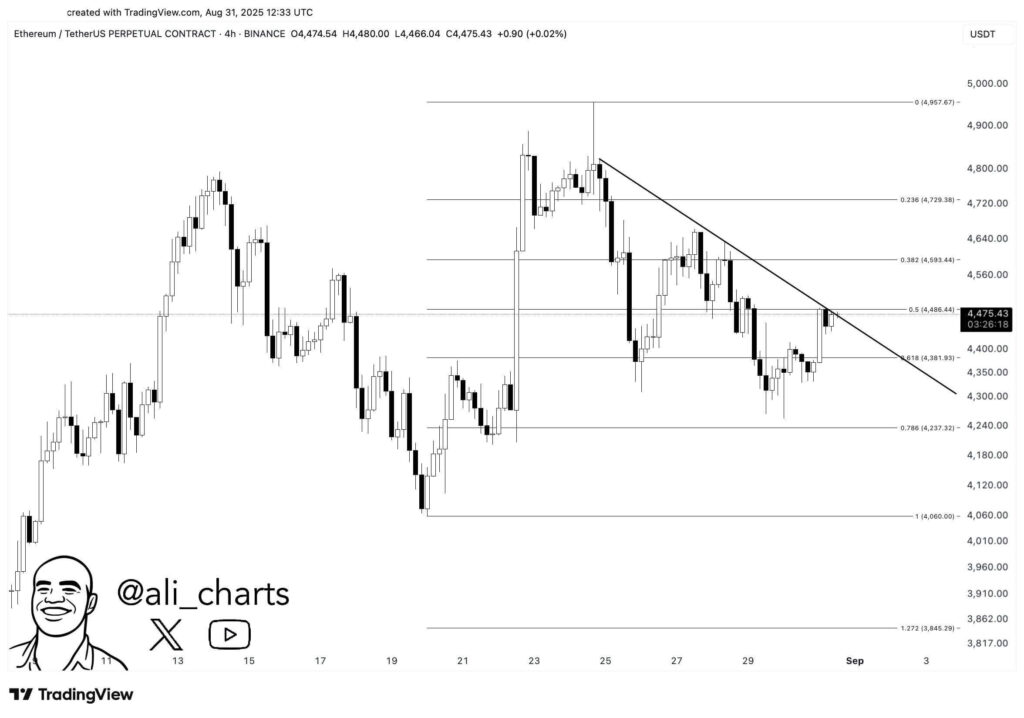 ETH/USD 4-hour price chart, Source: Ali on X
A sustained advance past the 0.382 and 0.236 retracements would confirm bullish momentum. Failure to breach these levels may reinforce the current bearish structure and invite a deeper retracement.
Frequently Asked Questions
What should traders watch to confirm a bullish breakout?
Watch a decisive close above $4,500 on increased volume, a retest that holds as support, and follow-through toward $4,593 and $4,729. Confirmation reduces false-break risk.
How can investors manage downside risk if support fails?
Use staged stop-loss levels near $4,200 and $4,060, reduce position size if the $4,362–$4,200 band breaks, and consider accumulation only when price reaches historically supported zones like $3,600–$3,400.
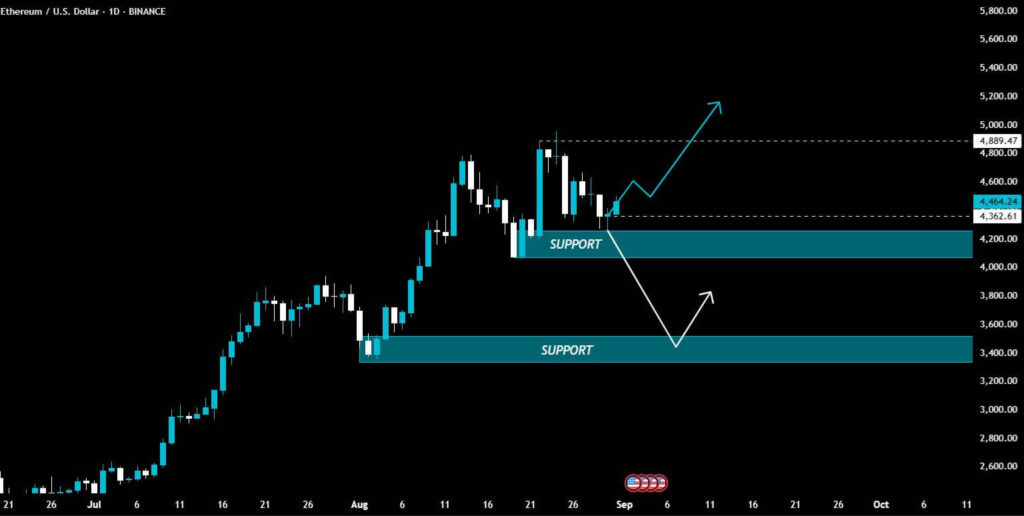 ETH/USD 1-day price chart, Source: RJT WAGMI on X
Key Takeaways
- Immediate bias: Break above $4,500 signals bullish continuation.
- Critical support: $4,362–$4,200 must hold to avoid deeper retracement.
- Risk management: Use staged stops and watch volume for breakout validation.
Conclusion
Ethereum price sits at a technical crossroads between $4,500 resistance and $4,362 support. Monitoring Fibonacci levels, trendline behavior, and volume will provide the clearest signals for the next move. Traders should prepare for both breakout and breakdown scenarios with defined risk controls and clear profit targets.