BUILDon Stands Tall in a Red Market, Approaches All-Time High

BUILDon (B) is today’s top gainer on the BNB Chain, fueled by bullish momentum indicators. With $0.74 resistance in sight, traders weigh upside potential against profit-taking risks.
Despite a market-wide pullback, BUILDon (B), a meme coin built on the BNB Chain, has emerged today’s top gainer. It trades at $0.71, climbing 4% in the past 24 hours.
Technical readings show the token’s momentum is backed by strong buying pressure. If demand holds, B could retest its all-time high of $0.74 and potentially push beyond it.
Traders Pile Into BUILDon
B/USD daily chart readings show the token’s Relative Strength Index (RSI) trending upward, reflecting sustained buying pressure among spot market participants. As of this writing, the momentum indicator stands at 65.34.
For token TA and market updates: Want more token insights like this? Sign up for Editor Harsh Notariya’s Daily Crypto Newsletter .
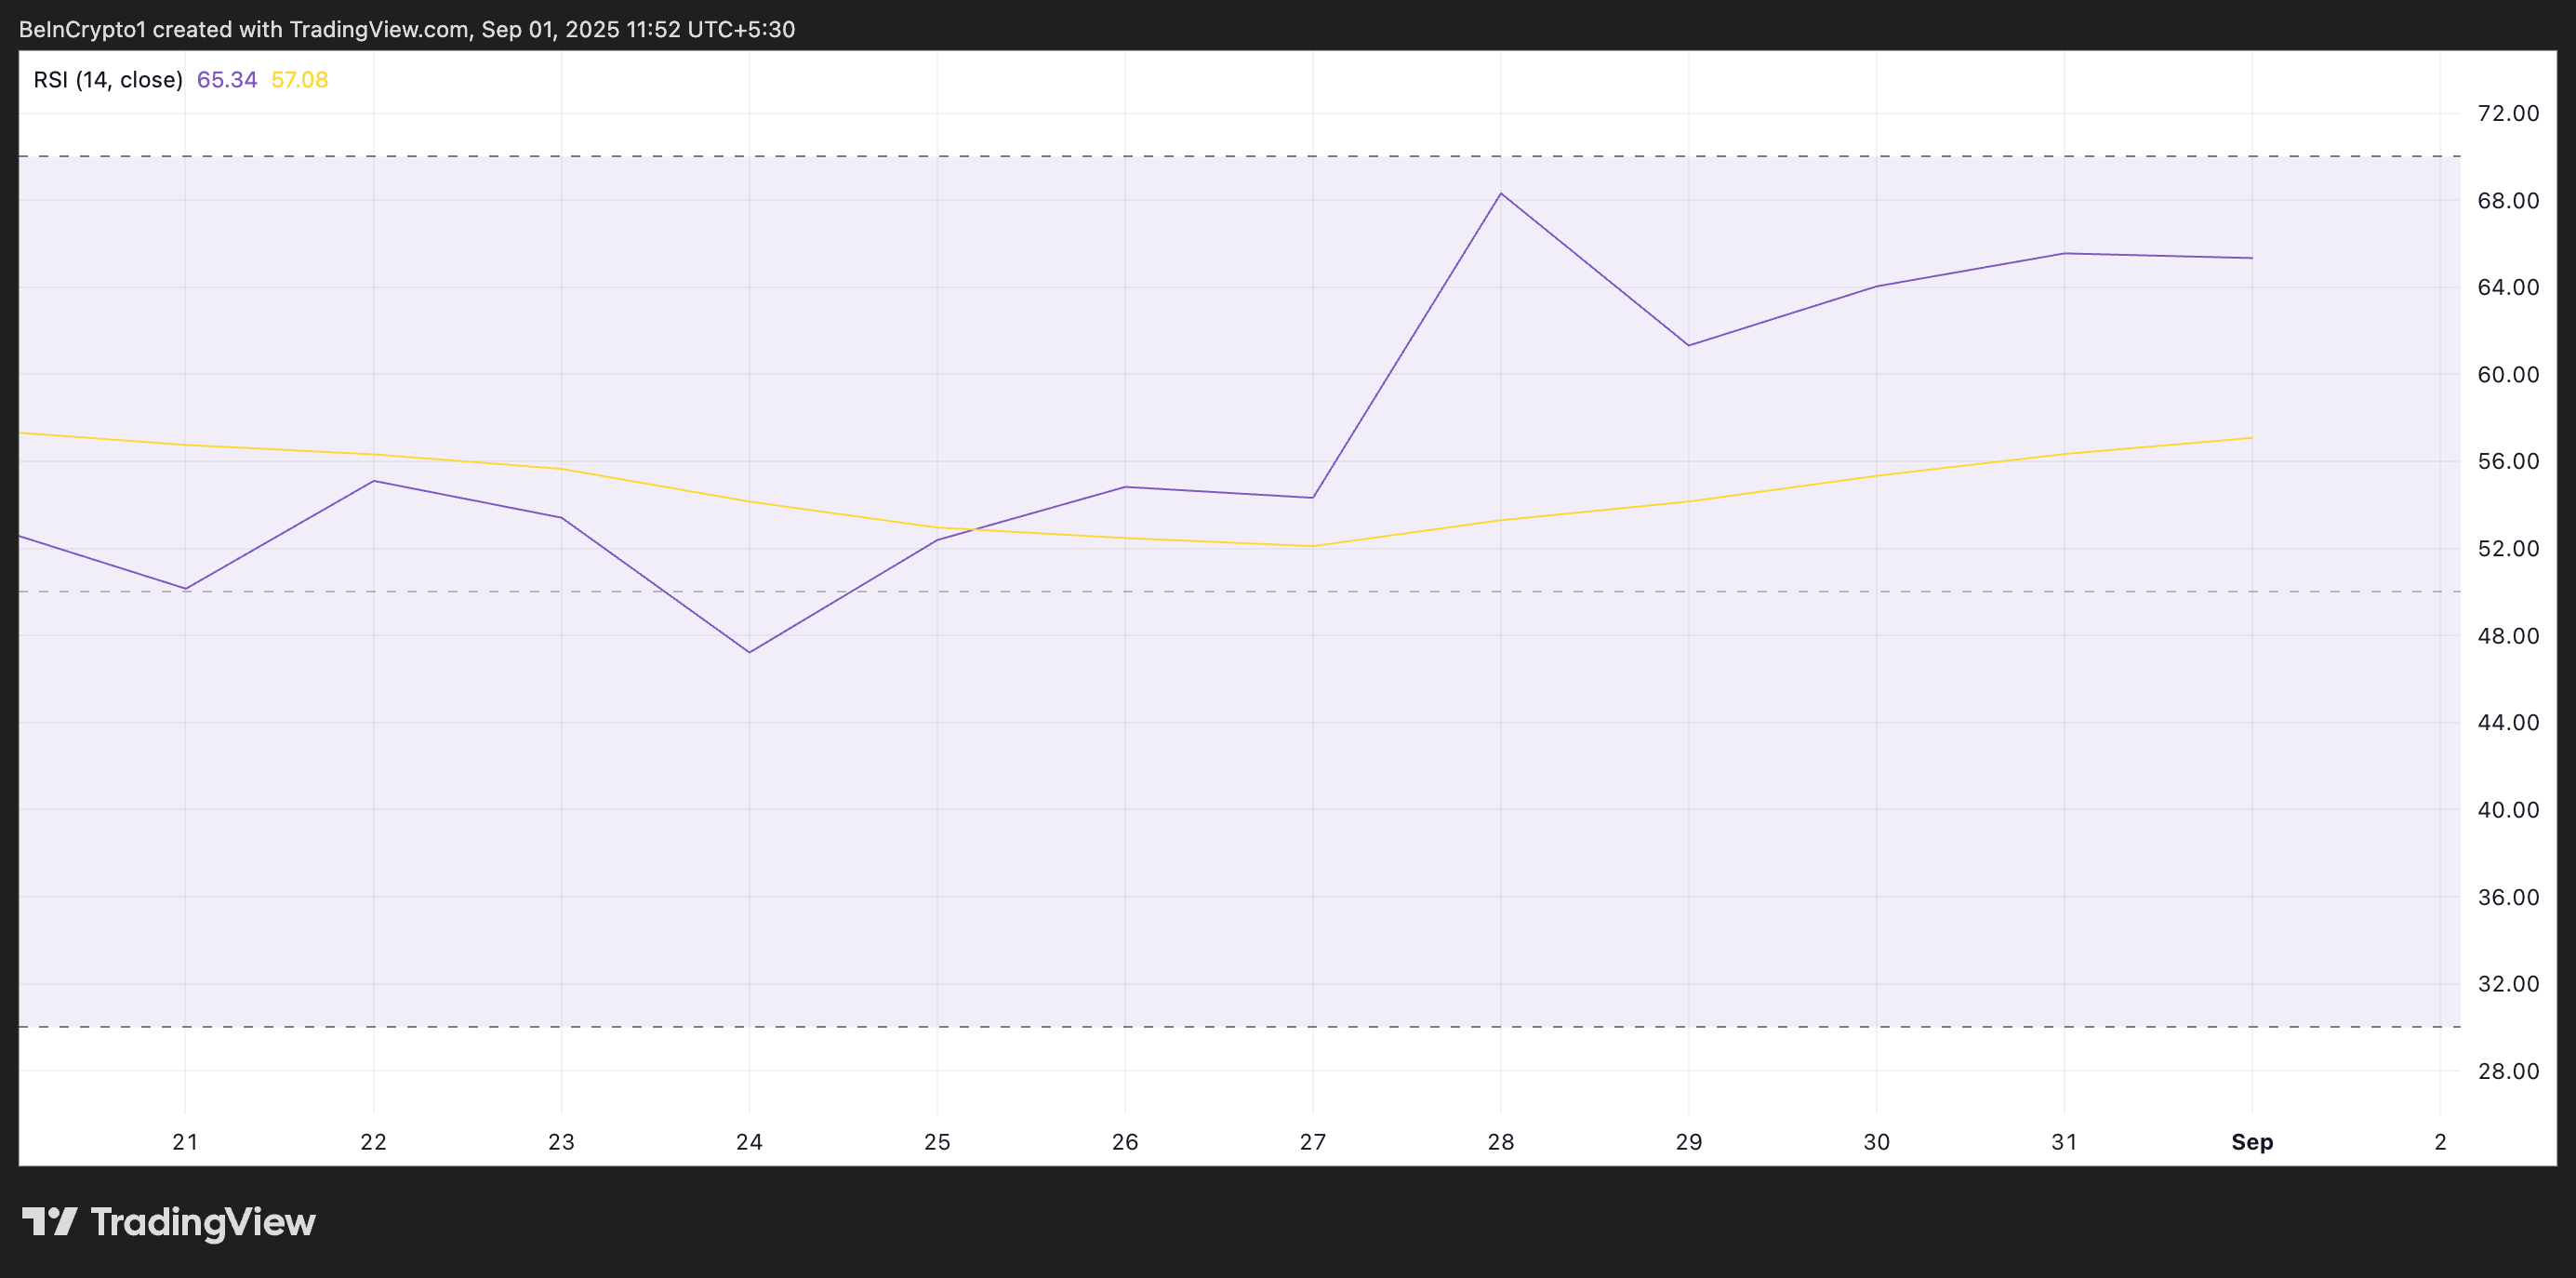 BUILDon RSI. Source:
TradingView
BUILDon RSI. Source:
TradingView
The RSI indicator measures an asset’s overbought and oversold market conditions. It ranges between 0 and 100. Values above 70 suggest that the asset is overbought and due for a price decline, while values under 30 indicate that the asset is oversold and may witness a rebound.
B’s RSI reading of 65.34 indicates room for further upside before the token becomes overbought and witnesses a decline. The steady climb in the RSI value reflects consistent buying pressure from traders, suggesting B investors remain confident in the token’s short-term trajectory.
Moreover, the setup of B’s Moving Average Convergence Divergence (MACD) indicator confirms the growing bullish momentum. At press time, B’s MACD line (blue) rests above the signal line (orange), with the green histogram bars growing in size — a sign that bullish activity is increasing.
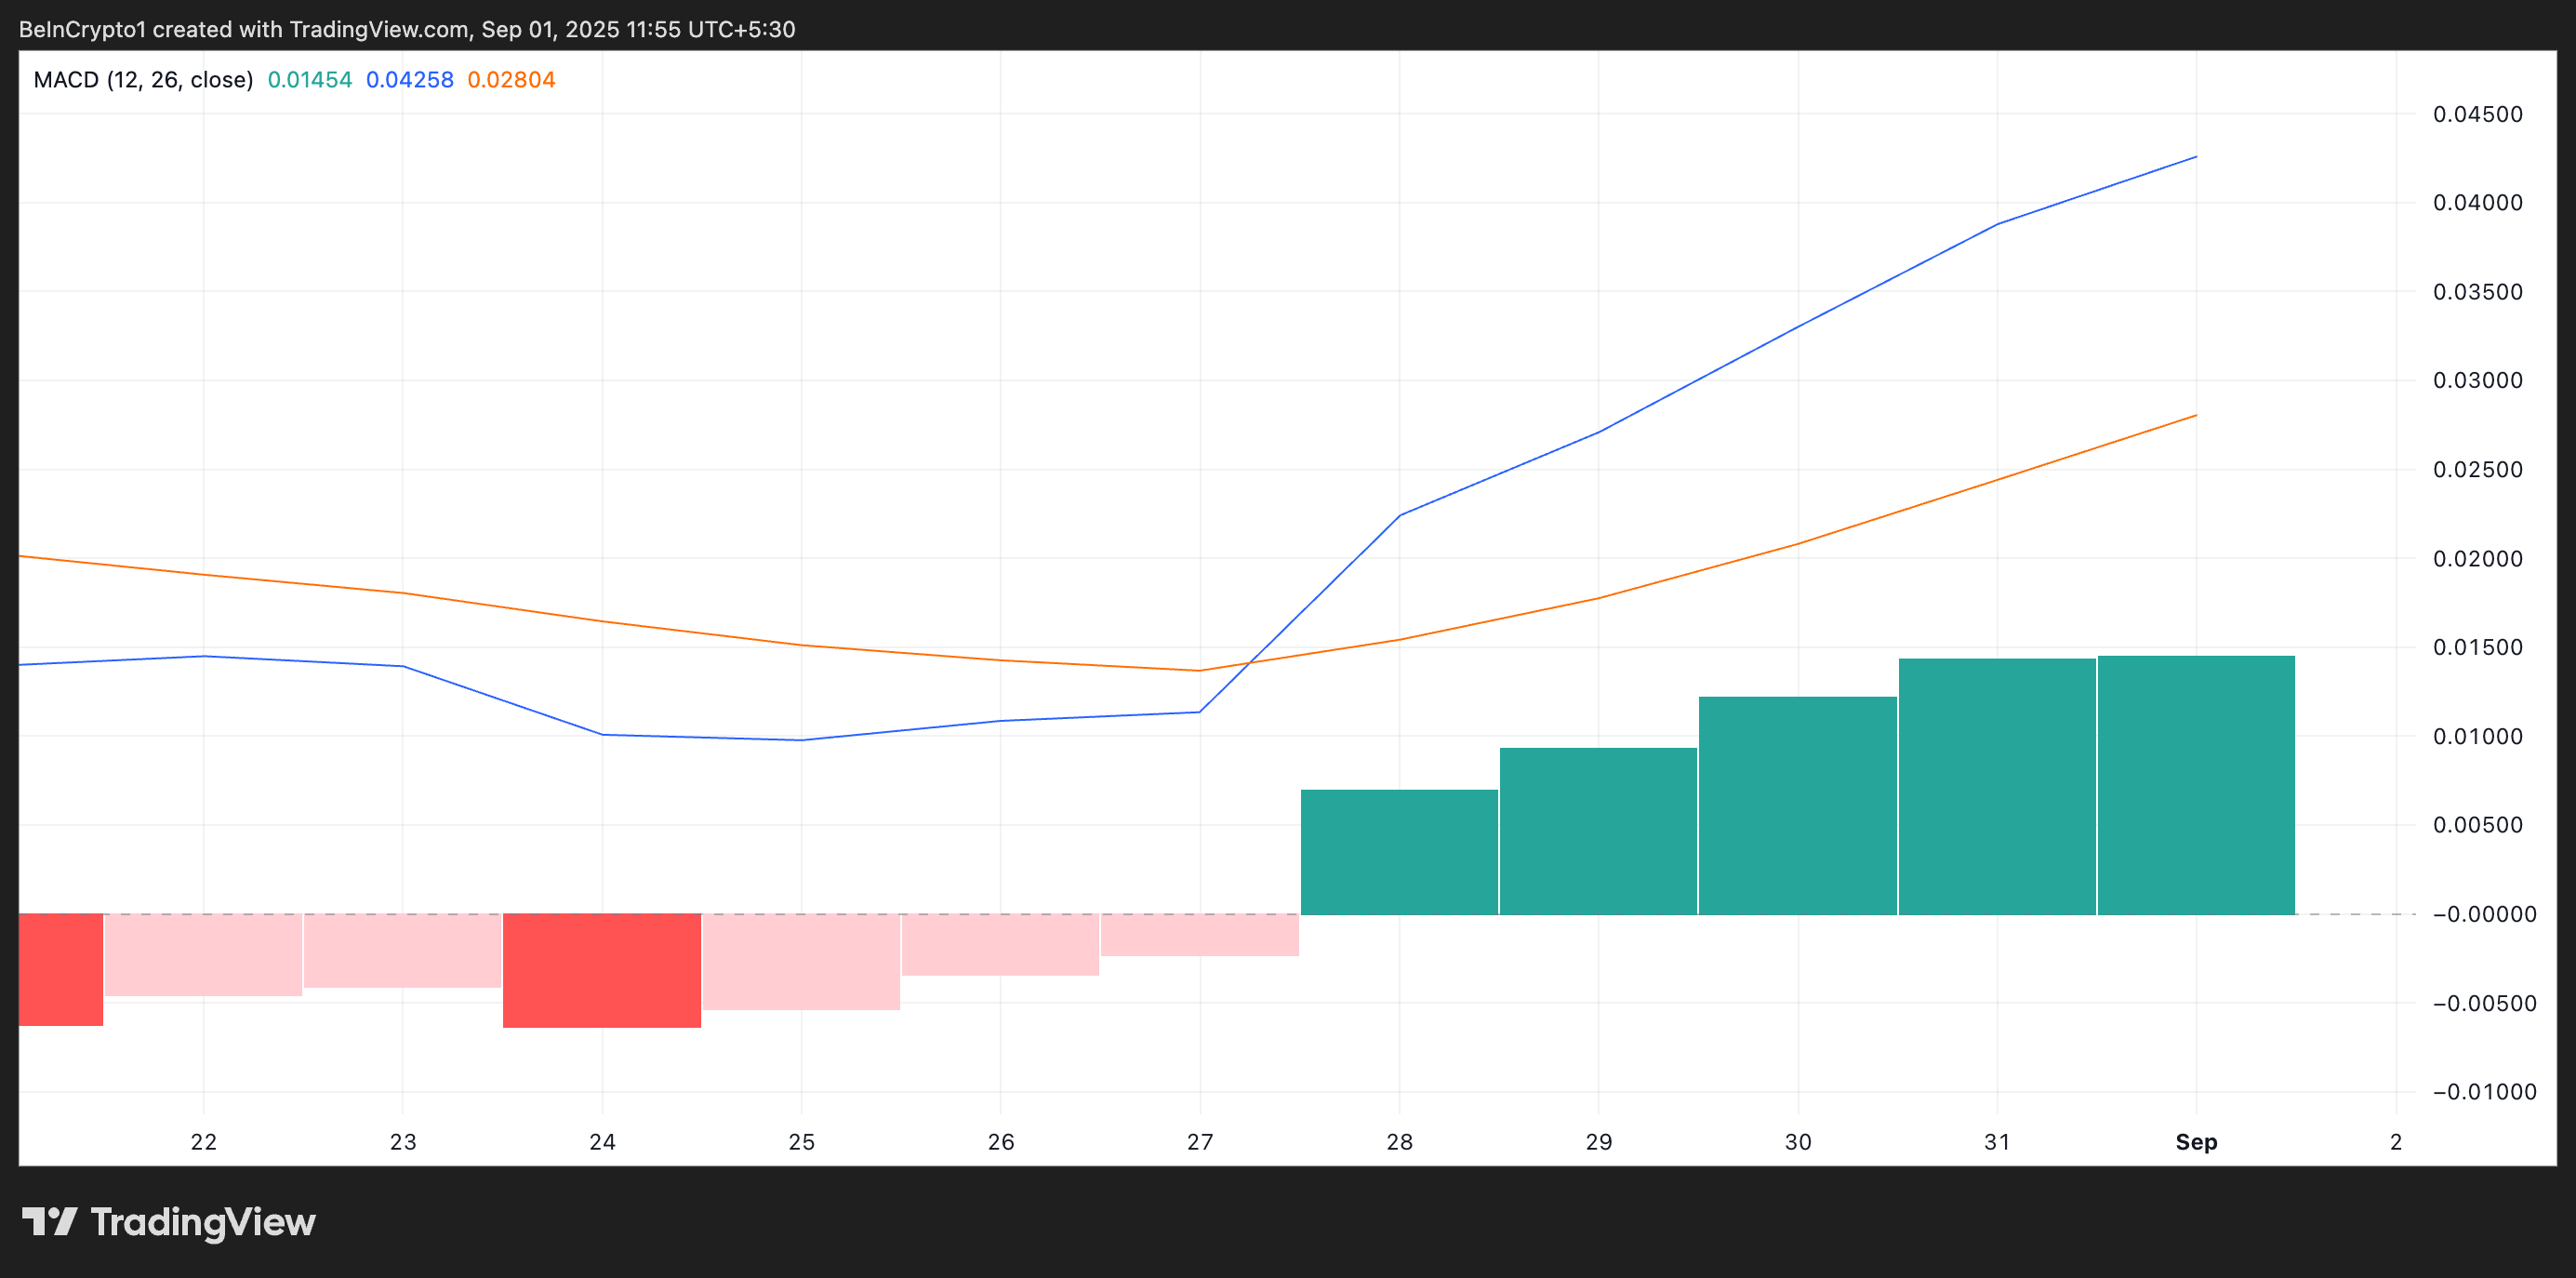 BUILDon MACD. Source:
TradingView
BUILDon MACD. Source:
TradingView
The MACD indicator identifies trends and momentum in its price movement. It helps traders spot potential buy or sell signals through crossovers between the MACD and signal lines.
As with B, when the MACD line rests above the signal line, it signals declining selling pressure and growing buy-side strength.
Profit-Takers Circle as BUILDon Approaches All-Time High
An uptick in BUILDon’s demand could drive the token toward its all-time high of $0.74, with the possibility of breaking past it if momentum strengthens.
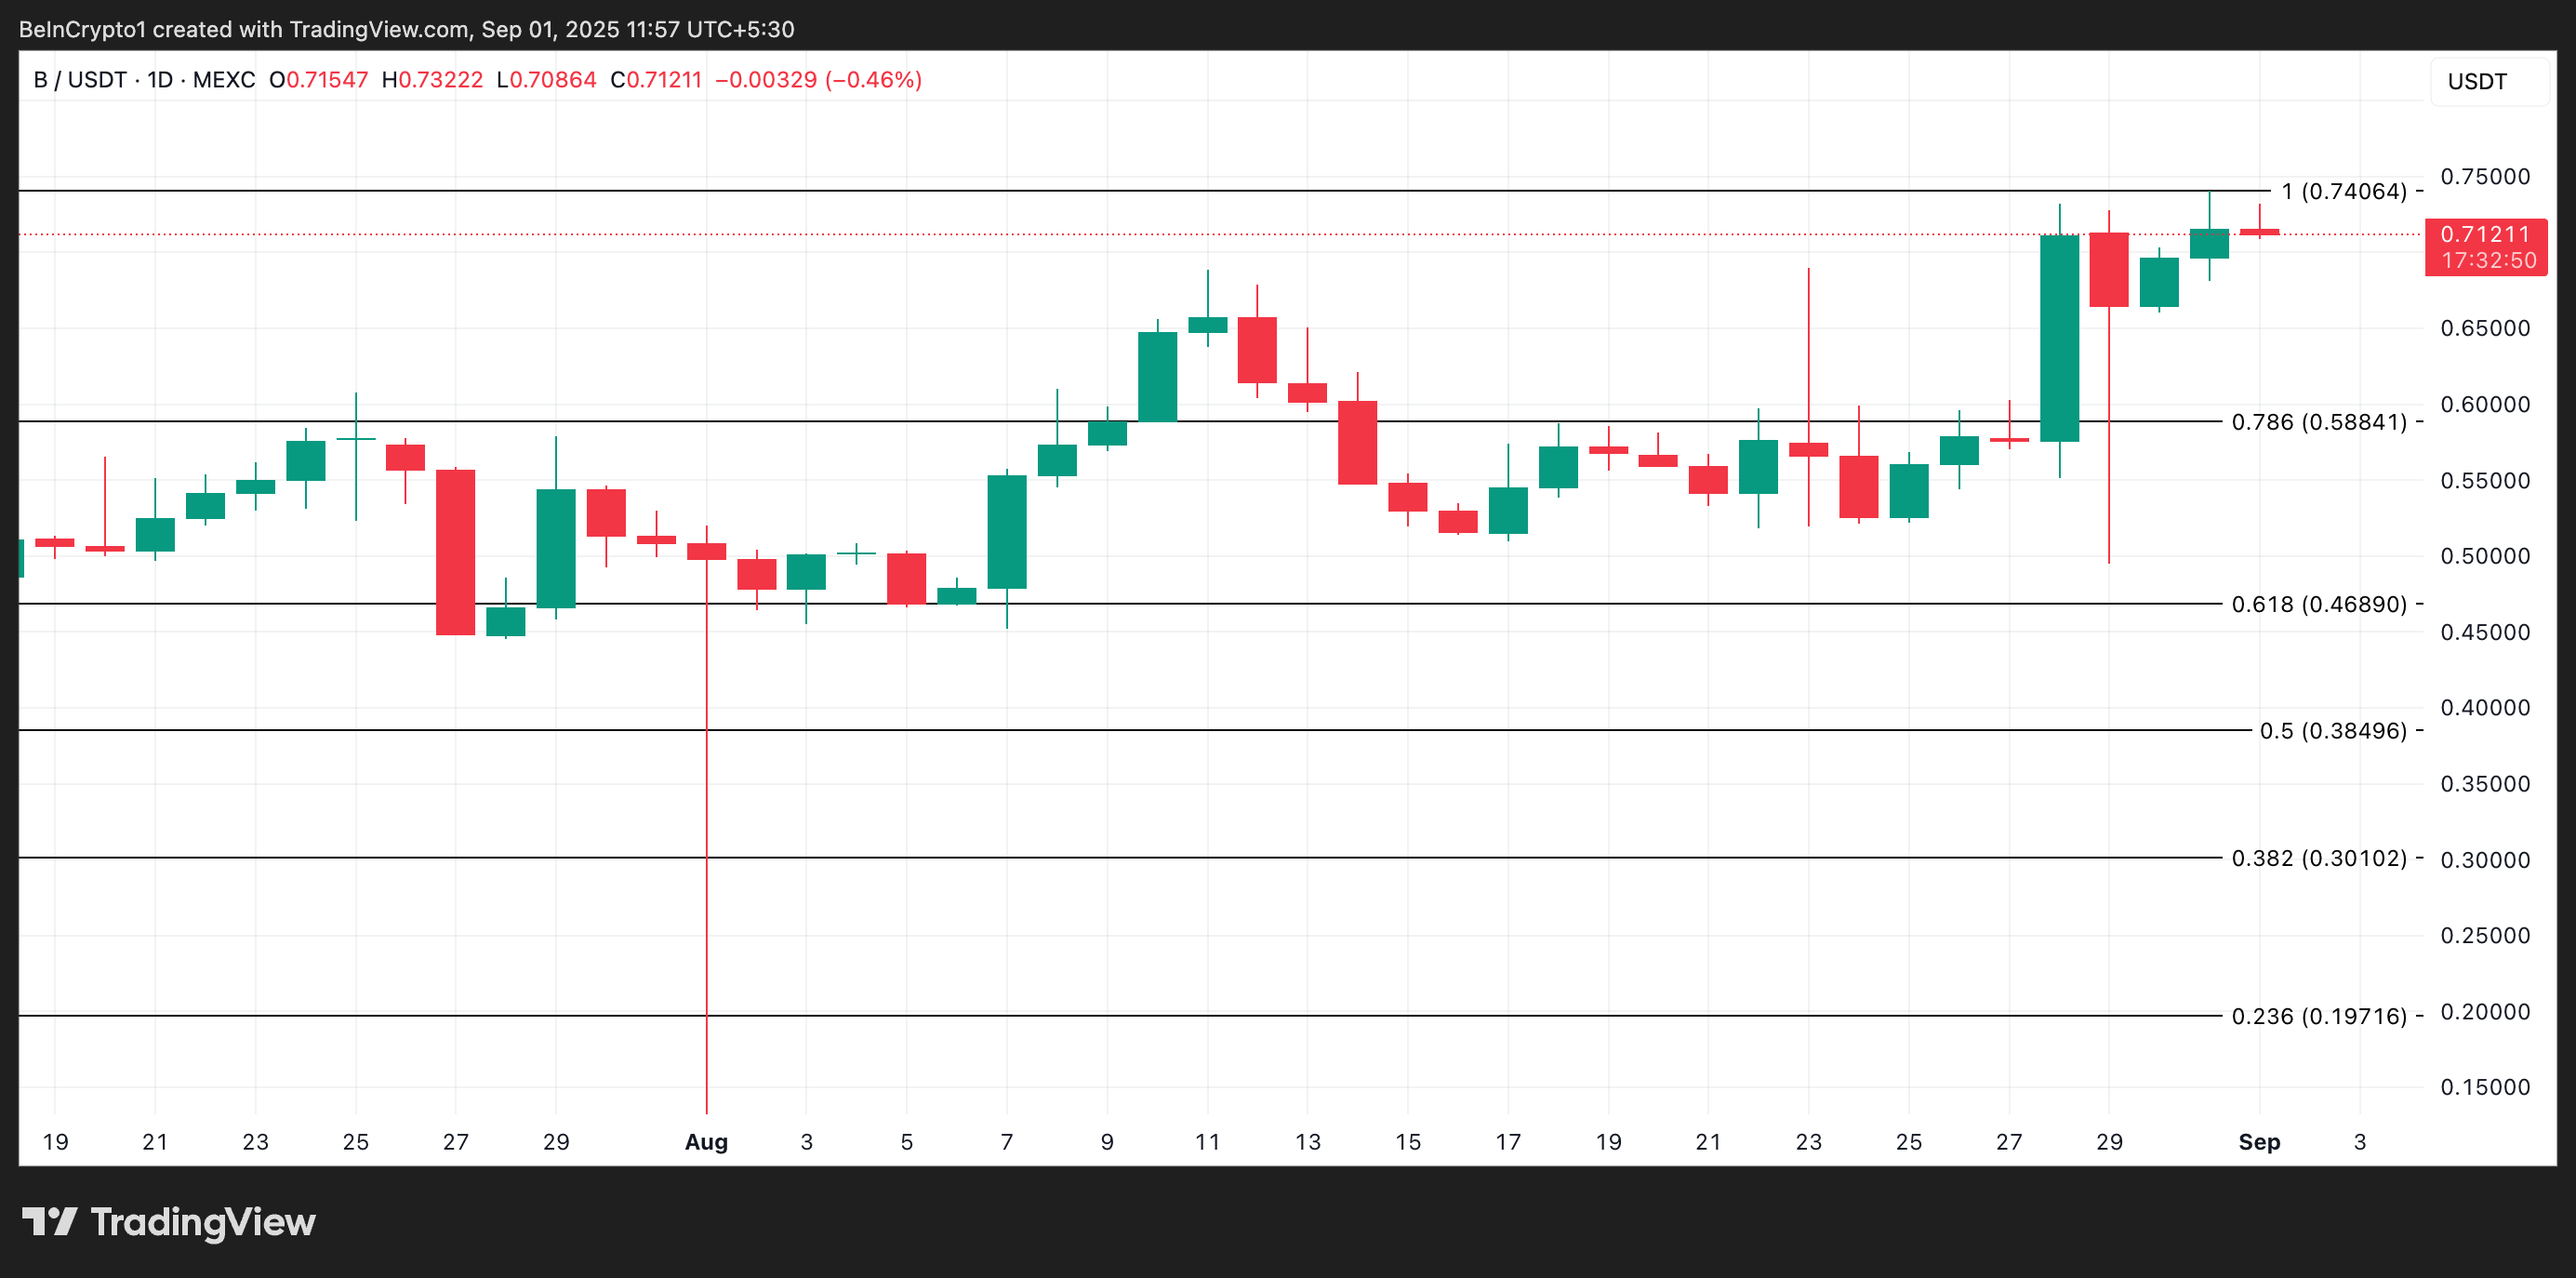 BUILDon Price Analysis. Source:
TradingView
BUILDon Price Analysis. Source:
TradingView
However, a rejection at this resistance level may trigger short-term profit-taking, potentially pulling the price back down toward $0.58.
Disclaimer: The content of this article solely reflects the author's opinion and does not represent the platform in any capacity. This article is not intended to serve as a reference for making investment decisions.
You may also like
Bitcoin plunges 30%. Has it really entered a bear market? A comprehensive assessment using 5 analytical frameworks
Further correction, with a dip to 70,000, has a probability of 15%; continued consolidation with fluctuations, using time to replace space, has a probability of 50%.

Data Insight: Bitcoin's Year-to-Date Gains Turn Negative, Is a Full Bear Market Really Here?
Spot demand remains weak, outflows from US spot ETFs are intensifying, and there has been no new buying from traditional financial allocators.
Why can Bitcoin support a trillion-dollar market cap?
The only way to access the services provided by bitcoin is to purchase the asset itself.
Crypto Has Until 2028 to Avoid a Quantum Collapse, Warns Vitalik Buterin