Date: Sat, Sept 06, 2025 | 11:56 AM GMT
The cryptocurrency market is continuing its choppy consolidation as Ethereum (ETH) hovers around $4,300, cooling off from its recent high of $4,954 — a drop of more than 13% in just weeks. This weakness has spilled over into major altcoins including Kaspa (KAS).
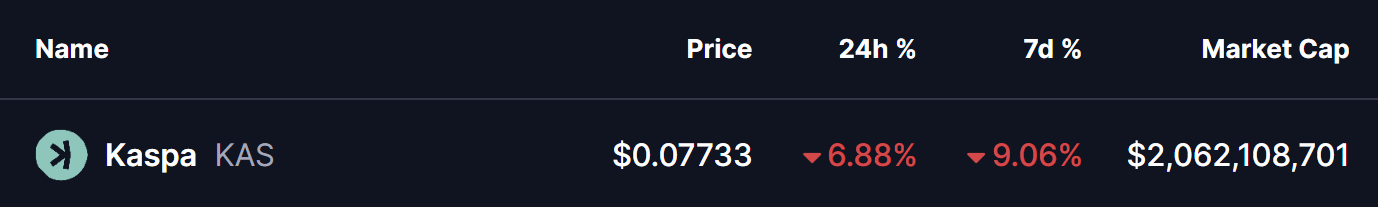
KAS is trading in the red, down by over 9% in the past week, and its current chart structure is now pointing toward a familiar setup that could shape its next major move.
 Source: Coinmarketcap
Symmetrical Triangle in Play?
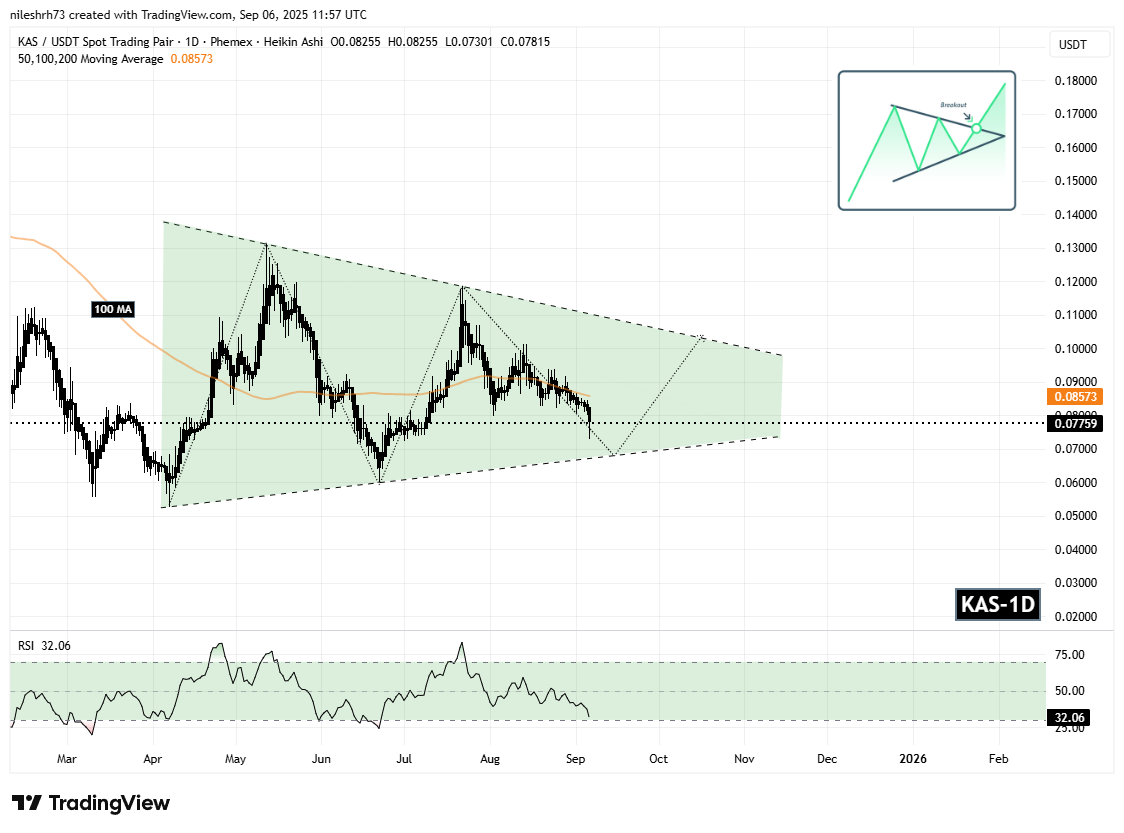
On the daily chart, KAS is forming a Symmetrical Triangle pattern — a setup that often signals a continuation but can break either way depending on market momentum. In the short term, however, price action leans toward further downside before any potential rebound.
The rejection from the resistance trendline near $0.1185 in late July triggered a sharp pullback, with KAS now trading around $0.07740, marking a 34% drop from its upper resistance trendline.
 Kaspa (KAS) Daily Chart/Coinsprobe (Source: Tradingview)
What’s Next for KAS?
If this pattern continues to unfold, KAS could extend its decline toward the lower wedge boundary near $0.068, implying another 12% drop from current levels.
However, if KAS finds support along the wedge’s lower trendline and successfully reclaims its 100-day moving average (100 MA) at $0.0857, it could confirm the start of a bullish wave, potentially leading to a breakout from the symmetrical triangle and setting the stage for a push toward higher levels.
Meanwhile, the Relative Strength Index (RSI) is at 32, suggesting that the token is approaching oversold conditions, leaving room for a rebound attempt in the coming sessions.