
Shiba Inu (SHIB) Biggest 2025 Breakout Is Around, Bitcoin (BTC) Recovery Failed, Ethereum (ETH): Worst Since Hitting $4,000? - U.Today

The market might be on the verge of a big volatility surge in the next few weeks. Shiba Inu is forming a breakout pattern, Bitcoin might hit new lows quite soon, and Ethereum is in its worst state since it climbed back above $4,000.
Shiba Inu: Steady and ready
One of the biggest breakouts of SHIB in 2025 may be on the horizon as the asset coils tighter within a symmetrical triangle. Since the middle of August, the pattern has been developing with higher lows and lower highs combining to form a condensed range around $0.00001236. For SHIB traders, the next few days are crucial because these setups usually resolve with significant volatility.
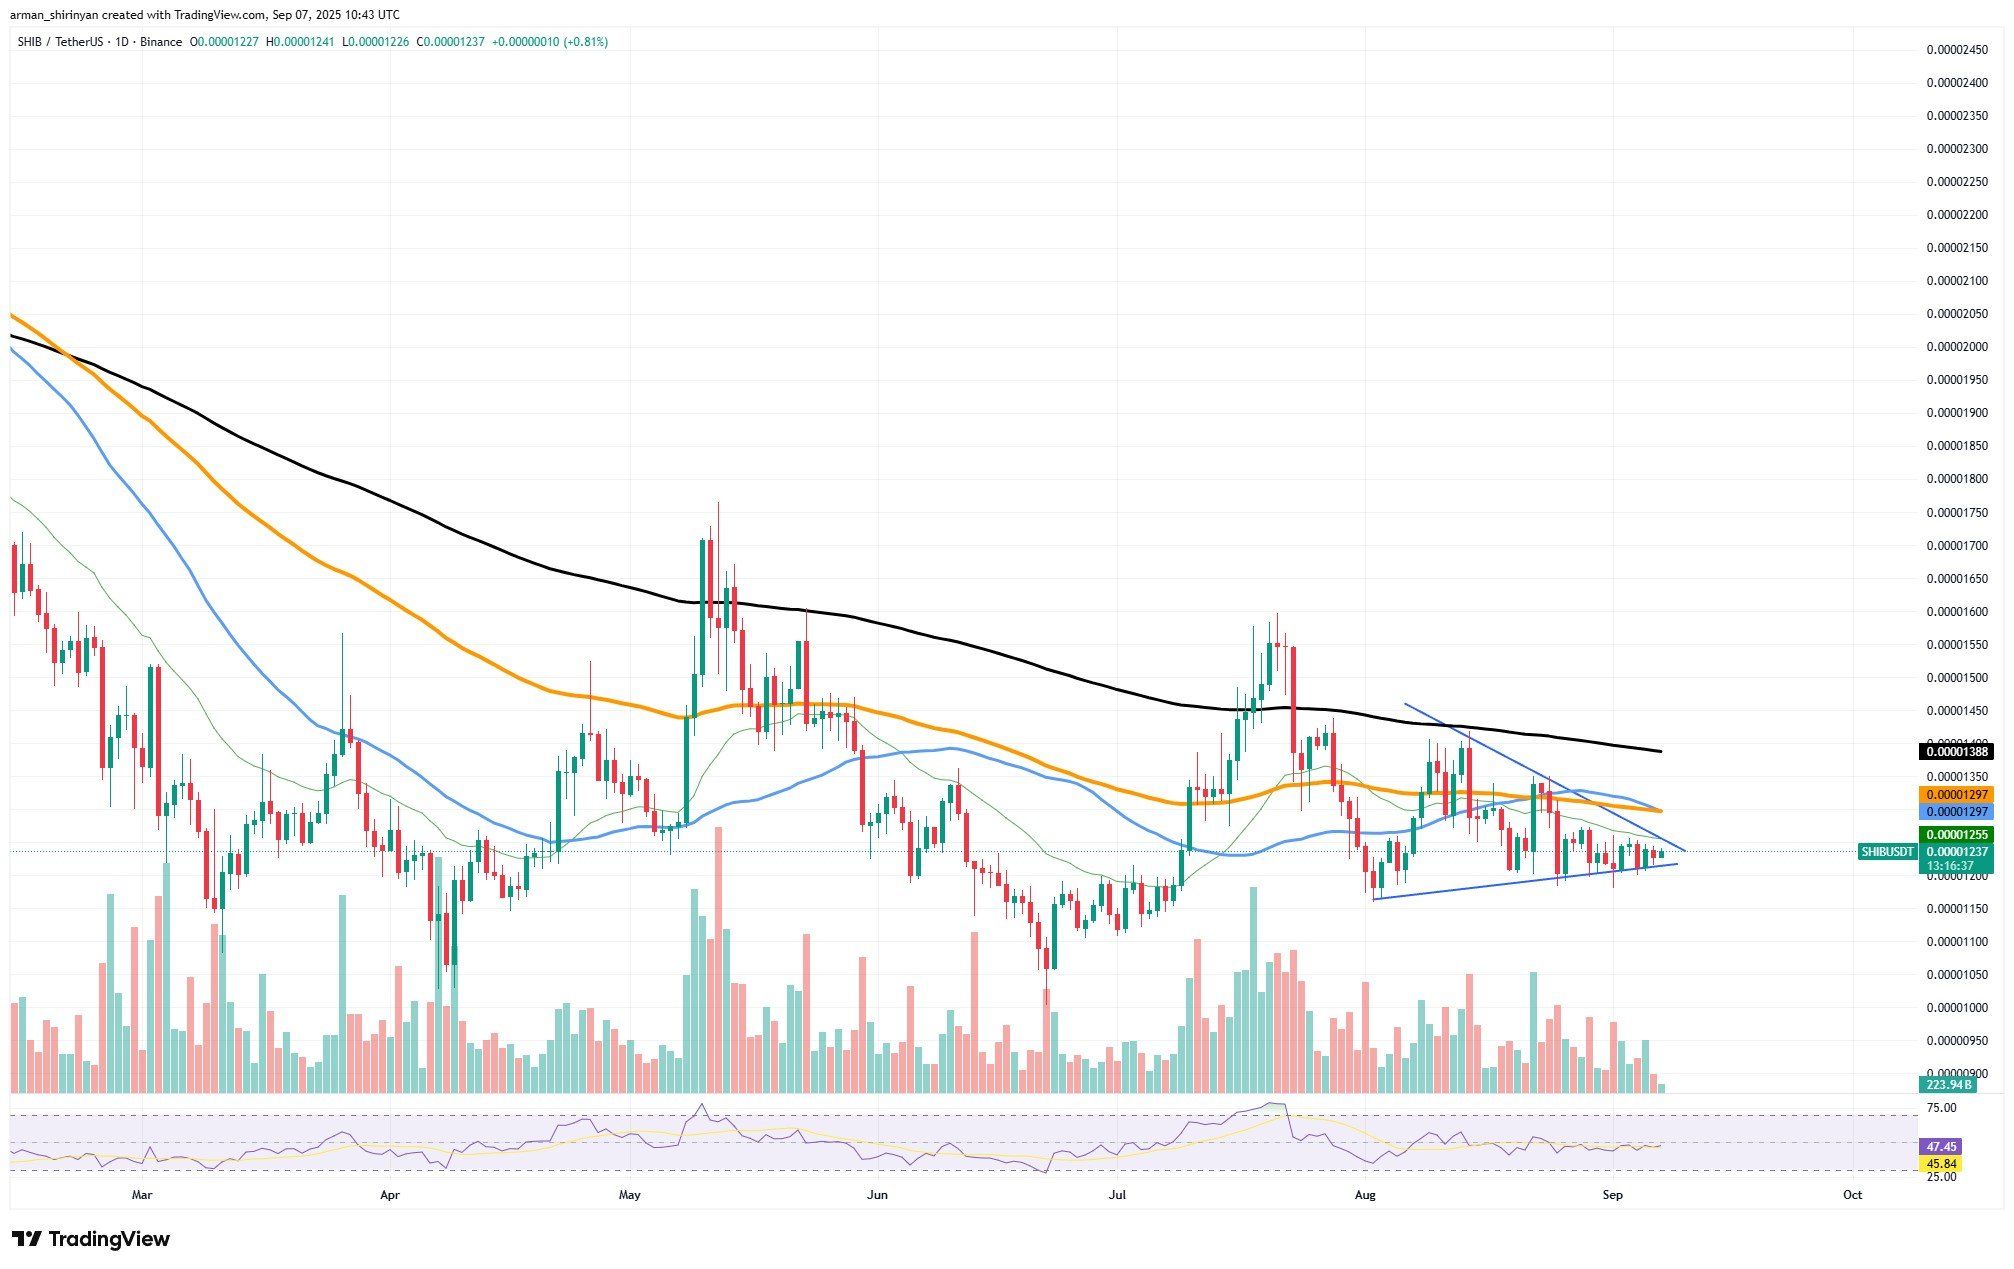
- A verified breakout above the upper trendline would put immediate resistance at $0.00001297 (100-day EMA) on the bullish side. If there is a significant volume clearing this level, SHIB may move toward the 200-day EMA at $0.00001388.
- The $0.00001450-0.00001500 region, last observed in July where prior rejection initiated the current downtrend, could even be tested by a more vigorous rally. The larger structure would shift back in favor of bulls if momentum continued above these levels.
- On the other hand, the triangle may break downward if SHIB is unable to maintain its base close to $0.00001200. The first support would be $0.00001150, and bears would then have the chance of retesting the $0.00000950 zone, which hasn’t been seen since the early summer.
Indecision is highlighted by technical indicators. The neutral configuration is highlighted by the RSI, which is at 47 and neither overbought nor oversold. As the breakout direction is determined, volume has been steadily declining during the consolidation, which is a classic prelude to a big move.
All things considered, Shiba Inu is getting closer to the summit of a significant triangle. For confirmation, traders should keep a close eye on $0.00001297 on the upside and $0.00001200 on the downside. SHIB’s largest move of 2025 might be a bullish breakout, which could rekindle retail enthusiasm if momentum pushes it toward the mid-$0.00001400s.
Bitcoin reversal limited
Recent attempts by Bitcoin to recover have failed, suggesting that the post-sell-off bounce may already be at its limit. Bitcoin failed to overcome this crucial resistance once more after rallying to retest the $112,000 area, leaving the larger structure open to additional declines.
Due to its location just below the 50-day moving average (blue line) and the local resistance cluster between $114,000 and $116,000, the rejection at $112,000 is especially significant. Bulls could have regained short-term momentum with a successful breakout here, but the inability to hold higher levels indicates that sellers are still in control. Bitcoin is currently trading at about $111,121, but there is a growing chance that it will fall further.
The 100-day EMA, which is located close to $110,785, is the next important support. Bitcoin will probably test the 200-day EMA at $104,520 — a level that hasn’t been reached since May, if this doesn’t hold. Following the robust rally earlier this summer, such a move would confirm a deeper correction phase.
Momentum indicators support this pessimistic outlook. A lack of buying strength is indicated by the RSI, which is at 46, just below neutral. Compared to June and July, trading volume has also drastically declined, indicating a noticeable drop in market zeal. Bitcoin appears more likely to grind lower rather than stage another quick surge in the absence of fresh demand inflows.
Ethereum stalemate ends
Following weeks of intense volatility, Ethereum's price action has flattened out entering a stalemate phase. With its current price hovering around $4,300, ETH is having trouble gaining traction and the overall picture indicates that momentum is ebbing rather than increasing. Short-term moving averages are the problem. At $4,144, ETH is currently sandwiched between the 26-day EMA and the 50-day EMA.
Normally, this squeeze indicates an impending breakout, but in this instance the setup appears more bearish than bullish. ETH may have already peaked for this leg of the cycle, according to worries raised by its inability to regain significant upward momentum after breaking $4,000 earlier in the summer. If sellers seize the initiative, ETH may first test the 100-day EMA level of $3,607, which served as dynamic support during the July rally.
Failure there would probably push the asset closer to the 200-day EMA, which is at about $3,190, and would indicate a more severe correction phase. Conversely, a recovery could occur, but given the current technicals, the likelihood seems low. With the RSI at 52, it is close to neutral but does not have the strength to enter overbought territory. Additionally, since mid-August trading volumes have been dropping, indicating hesitancy on the part of both bulls and bears.
It is unlikely that ETH will experience a sustained rebound in the absence of a spike in demand. To put it briefly, Ethereum is displaying its weakest position since regaining the $4,000 mark. ETH may continue to move lower over the next few weeks due to a chart setup that leans toward a downside break and the lack of obvious bullish catalysts. Whether Ethereum stabilizes or moves into its next correction wave will be determined by traders in the $4,144-$3,607 range.
To summarize, the market is in a weird position: Some assets clearly show a possibility of a recovery, while others are struggling to reach values that we've witnessed a few weeks ago. Realistically, the market can go both ways, but with Bitcoin struggling to recover, the bullish scenario seems unlikely.
Disclaimer: The content of this article solely reflects the author's opinion and does not represent the platform in any capacity. This article is not intended to serve as a reference for making investment decisions.
You may also like
Do Kwon Wants Lighter Sentence After Admitting Guilt

Bitwise Expert Sees Best Risk-Reward Since COVID

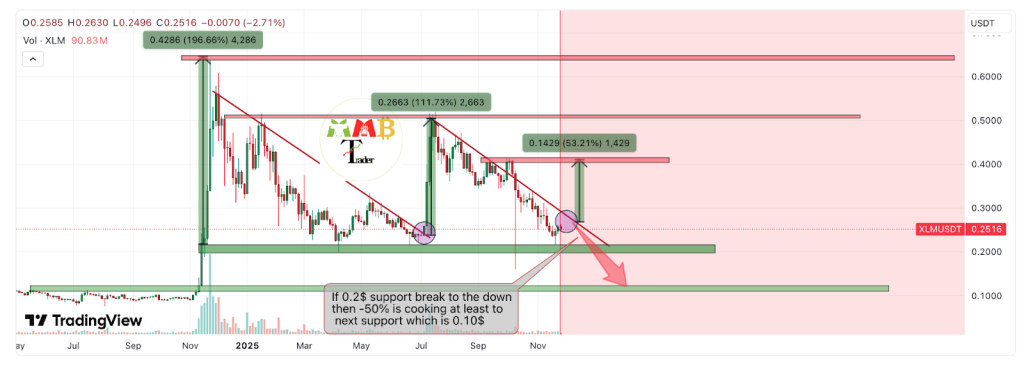
Stellar (XLM) Price Prediction: Can Bulls Push Toward $0.30 in December?
21Shares XRP ETF Set to Launch on 1 December as ETF Demand Surges