- LINK declined 4.18% in 24 hours to $20.06 with trading volume up 59.5% at $1.15 billion.
- The token continues to move within a long-term symmetrical triangle formed since mid-2021.
- Key levels remain $16.65 support, $22.24 resistance, and $35.07 as a potential upside target.
Chainlink, a decentralized oracle network and a blockchain abstraction layer that connects blockchains with off-chain data has recorded a new momentum through it LINK token. During today’s Asian trading session, the asset opened it market value with a price of $20.27. Following this, the digital asset reported changes in the market movement which remained stable through out.
Current Market Action Revealed
A look at the ongoing market action at the time of writing this article reveals that, Chainlink (LINK) is currently trading at $20.06, reflecting a 4.18% decline over the past 24 hours. The price opened near $21.01 before entering a downward trend throughout the session. Early fluctuations showed multiple small rebounds, but the overall direction remained negative.
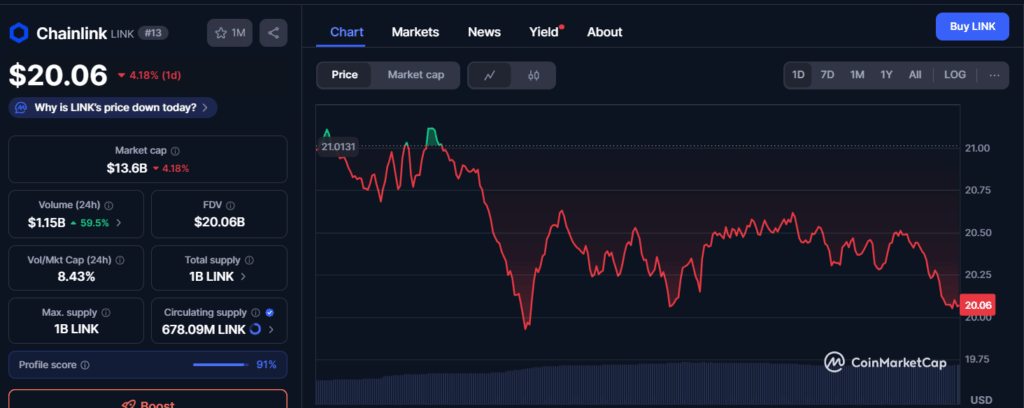
During mid-session, LINK experienced a sharp drop , temporarily falling below $20.25 before recovering slightly. Attempts to regain upward momentum were followed by continued lower highs and weaker buying pressure. The price remained below $20.75 through the second half of the charted period.
LINK’s value repeatedly tested the $20.25 to $20.50 range but failed to hold gains above those levels. The latest candle on the chart shows the price closing at $20.06, near the session low. Despite the price drop, trading volume increased by 59.5% within the last 24 hours, reaching $1.15 billion. Market cap also declined 4.18%, now standing at $13.6 billion. LINK showed persistent weakness throughout the observed 1-day chart timeframe.
Chainlink Price Moves Within Symmetrical Triangle, Approaches Key Technical Levels
As the price continues to hover in a stable manner, analysis prepared by Ali Charts reveals that Chainlink continues to trade within a symmetrical triangle formation that began developing in mid-2021. Weekly chart data shows the price compressing between descending resistance and rising support, forming a narrowing range over time.
Source: XThe pattern began near the $5.17 low, followed by months of upward movement forming higher lows into 2023. Throughout 2024 and 2025, LINK approached the triangle’s upper resistance several times, peaking near $22.24. The most recent weekly close shows LINK at $21.89, just below this resistance line.
Fibonacci retracement levels mark $16.65, $22.24, and $35.07 as critical reference points within the structure. A retest near the $16.65 support remains active within the pattern. Despite multiple attempts, LINK continues trading inside the triangle boundaries without confirming a breakout. Current movement follows the same pattern observed since late 2021, maintaining structure. As of the latest data, price volatility stays aligned with the long-term triangle formation, and no confirmation of breakout direction is present.