Ethereum price is poised for a record quarterly close above $3,700, signaling a confirmed breakout that targets $6,400 if the multi-month “W” structure holds. Key resistance bands at $4,158–$4,505 must be cleared to retest the $4,950 high and sustain a longer-term move toward $6,000+
-
ETH nears highest-ever quarterly close above $3,700 — breakout targets $6,400.
-
Immediate resistance clusters: $4,158, $4,307, $4,505; clearing them opens all-time high retest.
-
24h volume ~$27.2B; market cap ~$497.8B; circulating supply ~120.7M ETH — supportive liquidity.
Ethereum price update: ETH nears record Q3 close above $3,700 — read the resistance levels, targets, and trading outlook. Stay informed with COINOTAG analysis.
What is Ethereum’s Q3 outlook?
Ethereum price is approaching a potential record quarterly close above $3,700, which would confirm a multi-month breakout and point to aggressive upside targets of $6,000–$6,400 if momentum continues. Short-term resistance near $4,158–$4,505 must be overcome to validate the next leg higher.
How do resistance levels influence Ethereum’s next move?
Ethereum faces stacked resistance at $4,158, $4,307 and $4,505, identified by realized-price distributions and past heavy buying. Overcoming these zones would remove selling pressure and allow ETH to challenge the all-time high near $4,950. Volume, RSI divergence, and trendline breakout increase the probability of a decisive move.
Ethereum approaches record Q3 close above $3,700, with breakout patterns targeting $6,400 and resistance levels near $4,158–$4,505.
- Ethereum nears record quarterly close above $3,700, with breakout patterns signaling a $6,400 target.
- Key resistance zones remain at $4,158, $4,307, and $4,505 before price can retest the $4,950 high.
- Ethereum shows signs of entering an expansion phase, with long-term projections pointing toward $6,000.
If ETH closes above $3,700 this quarter, it would mark the highest quarterly close on record. Only two days remained before the Q3 candle closed in the referenced analysis. Chart patterns indicate that a confirmed breakout of the classic “W” structure points toward a longer-term target near $6,400.
Why does the price structure matter for Ethereum?
Longer timeframe chart structure shows Ethereum cleared long-term resistance near $3,000 after multiple failed attempts in 2022. The stronger momentum and sustained breakout increase the odds of a multi-quarter expansion phase. Technical confirmation on volume and momentum indicators supports this view.
#Ethereum Highest Quarter in History? 🚀
If #ETH closes above $3,700, this would mark the highest quarterly close ever. 📊
Only 2 days left until the Q3 candle closes.
If confirmed, the W structure breakout points to a target around $6,400.
— Titan of Crypto (Twitter), September 28, 2025
Ethereum traded at $4,124.29, recording a 3.1 percent gain within 24 hours, according to CoinGecko data. The intraday range ran between $3,971.15 and $4,141.84, reflecting steady upside momentum. Market capitalization reached approximately $497.8 billion, with circulating supply around 120.7 million ETH.
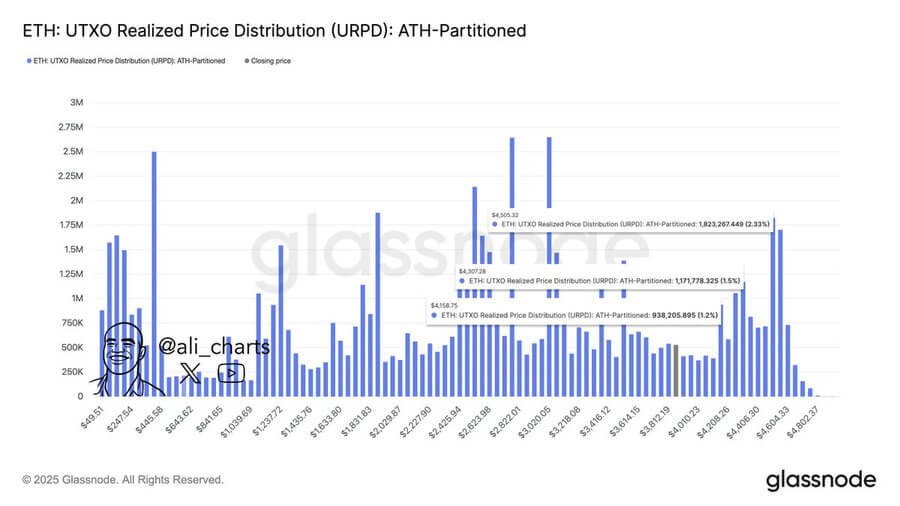 Source: AliCharts (X)
Additional resistance levels were identified using realized-price distribution and on-chain liquidity heatmaps (Glassnode, plain text reference). These zones reflect prior heavy buying where sellers may look to exit at breakeven. Clearing these levels is a prerequisite for an all-time high retest near $4,950.
How is trading activity supporting the move?
Trading volume remains robust, with a reported 24-hour volume of about $27.2 billion, indicating strong market participation. ETH also strengthened versus BTC, trading near 0.03678 BTC per ETH. The combination of volume and momentum suggests market participants are accumulating into the breakout.
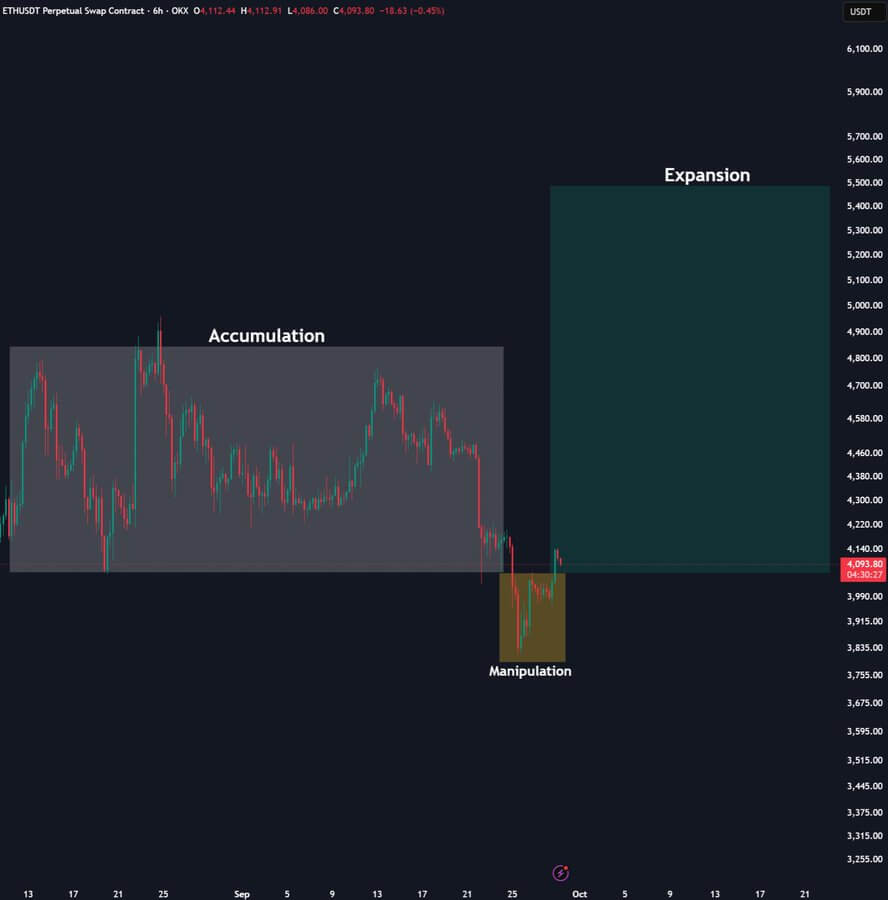 Source: ZYN (X)
ZYN’s pattern analysis indicates Ethereum has moved through accumulation and manipulation phases and is now in expansion. ZYN’s projection places a plausible $6,000 target by November 2025 if the expansion sustains. Technical indicators—bullish RSI divergence and trendline break—support a continuation scenario.
Frequently Asked Questions
What are the immediate resistance levels for Ethereum?
Immediate resistance levels are $4,158, $4,307 and $4,505. These bands correspond to prior high-volume buy zones where selling pressure could emerge; clearing them is key to challenging $4,950.
When would a long-term target of $6,400 become realistic?
If Ethereum confirms a quarterly close above $3,700 and sustains higher-volume rallies while holding trendline support, the technical “W” breakout would make $6,400 a realistic long-term target over subsequent quarters.
Key Takeaways
- Quarterly close matters: A close above $3,700 would be the highest quarterly finish for ETH and validate the breakout.
- Major resistance bands: $4,158–$4,505 must be cleared to retest highs; volume will confirm strength.
- Targets and timeline: Short-term targets range to $4,950; extended patterns point toward $6,000–$6,400 if momentum holds.
Conclusion
Ethereum’s near-term outlook is bullish conditional on a confirmed quarterly close above $3,700 and successive break of resistance bands at $4,158–$4,505. Technical and on-chain signals support an expansion phase, with possible targets from $4,950 up to $6,400 over the next quarters. Monitor volume and trendline support for trade confirmation.
Published: 2025-09-30 · Updated: 2025-09-30 · Author: COINOTAG