Date: Mon, Oct 06, 2025 | 02:55 AM GMT
The cryptocurrency market is showing renewed strength as both Bitcoin (BTC) and Ethereum (ETH) have surged over 13% in the past 7 days, with BTC recording a new all-time high at $125K. Riding on this bullish momentum, several altcoins are flashing breakout signals — and MultiversX (EGLD) is one of the notable names to watch.
EGLD has seen modest weekly gains, but its technical setup suggests that a larger move could be brewing soon.
 Source: Coinmarketcap
Descending Triangle in Play
On the daily chart, EGLD has been consolidating within a descending triangle pattern, where a series of lower highs press against a horizontal support base. This structure often indicates that price pressure is building up ahead of a major directional move.
After testing its support zone around $11.94, EGLD rebounded sharply, reclaiming ground toward $13.84 — now sitting right below the triangle’s upper boundary.
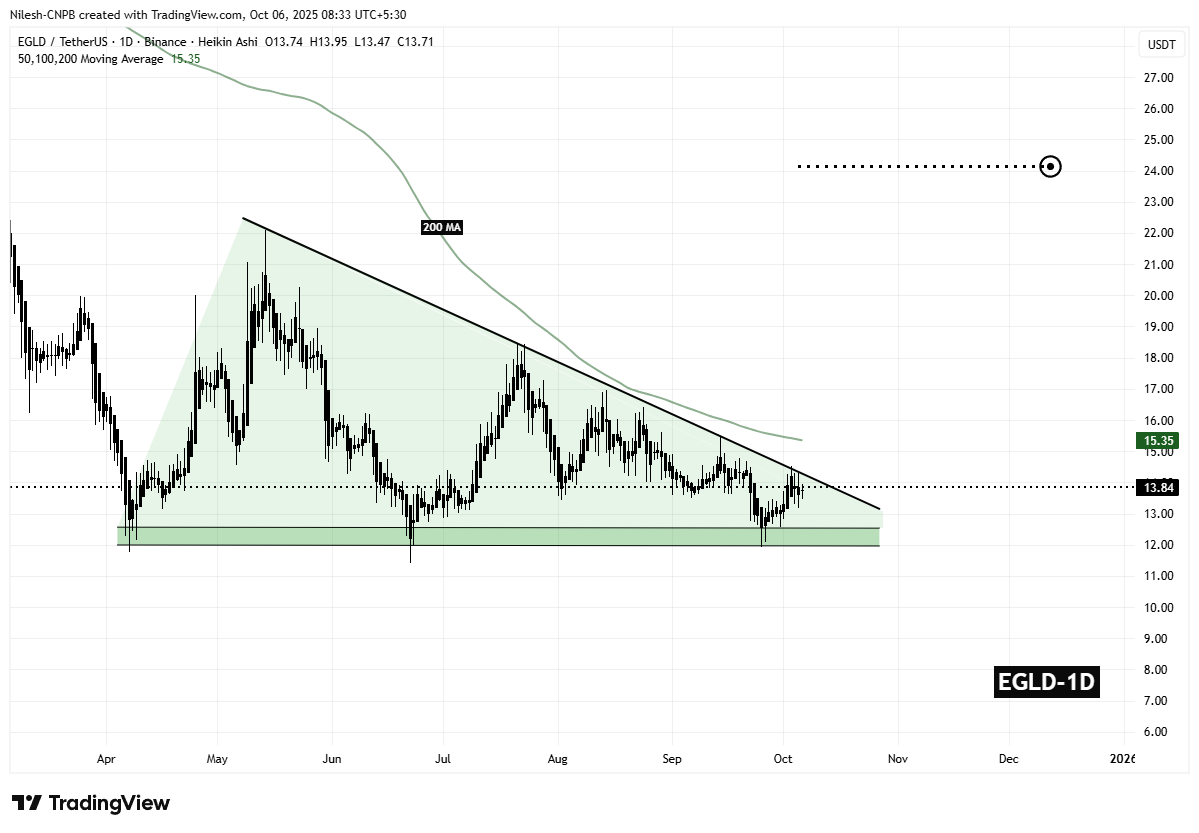 MultiversX (EGLD) Daily Chart/Coinsprobe (Source: Tradingview)
Meanwhile, the 200-day moving average (MA), currently positioned around $15.35, adds an additional layer of resistance that bulls must overcome for confirmation of a breakout.
What’s Next for EGLD?
If buyers manage to break above the triangle resistance and reclaim the 200-day MA ($15.35), it could spark a strong bullish continuation. In that case, EGLD may rally toward its projected target near $24.16, implying an upside potential of over 60% from current levels.
Such a breakout would not only mark the end of the multi-month consolidation but could also trigger fresh inflows from momentum traders, fueling additional upside.
However, if the breakout attempt fails, EGLD could once again revisit the $12 support region, where buyers will need to step in to keep the structure intact.