Date: Mon, Oct 06, 2025 | 05:58 AM GMT
The cryptocurrency market continues to show strong bullish momentum, with both Bitcoin (BTC) and Ethereum (ETH) surging over 10% in the past 7 days. Bitcoin has even hit a historic milestone, recording a new all-time high of $125K. Riding on this positive wave, several altcoins are beginning to flash bullish signals — and Litecoin (LTC) is one of them.
Over the past week, LTC has climbed nearly 13%, and its latest chart pattern suggests that a further upside could be on the horizon.
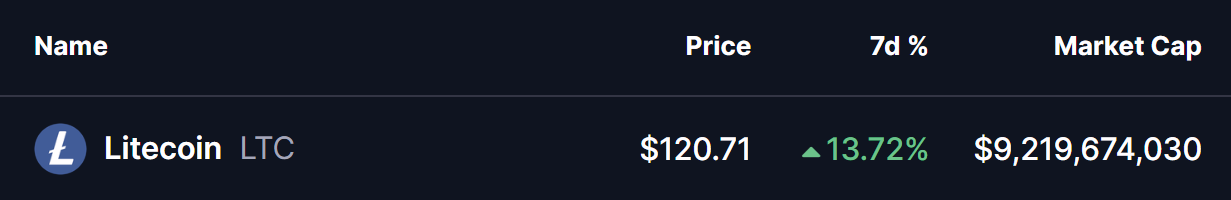 Source: Coinmarketcap
Bearish Cypher Harmonic Pattern in Play
On the daily chart, LTC is shaping a Bearish Cypher harmonic pattern — a structure that typically signals an ongoing bullish move before a potential reversal at higher resistance levels.
Currently, LTC is trading near $120.65, with the pattern indicating a likely move toward the $128.21–$134.18 zone — known as the Potential Reversal Zone (PRZ). This area aligns with the 0.786 and 1.0 Fibonacci extensions, two critical levels often used to identify where harmonic patterns complete.
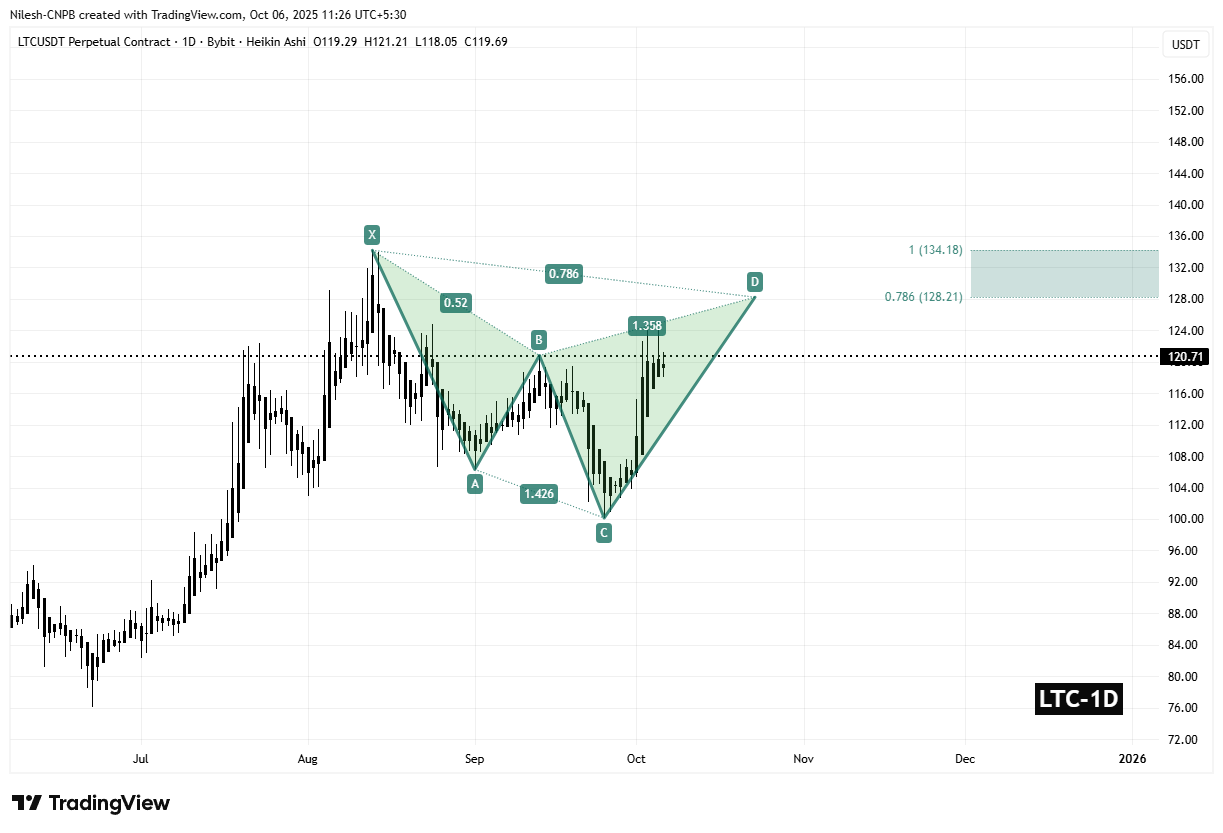 Litecoin (LTC) Daily Chart/Coinsprobe (Source: Tradingview)
If this formation continues to unfold as expected, LTC could see an additional 5%–11% rally before encountering key resistance in the PRZ.
What’s Next for LTC?
The coming days will be crucial for confirming this pattern’s completion. A sustained move toward the $128–$134 range would validate the harmonic setup, attracting the attention of pattern traders and technical analysts watching for a short-term upside continuation.
However, as with most harmonic completions, the PRZ could also act as a profit-taking zone, potentially leading to minor pullbacks or temporary consolidation before the next major move.
Despite that, the overall technical structure remains constructive, suggesting that LTC could maintain upward momentum in the short term before facing its next challenge near the upper boundary of the Cypher pattern.