From the 200-week moving average to the market cap ratio, estimate Ethereum's current bull run peak

Perhaps not as exaggerated as Tom Lee's $60,000 prediction, but can we expect around $8,000?
Original Article Title: Where might ETH Top?
Original Article Author: Michael Nadeau, The DeFi Report
Original Article Translation: Luffy, Foresight News
Tom Lee recently proposed at the Korea Blockchain Week that Ethereum's mid-term target price is $60,000, stating that Ethereum is currently in a supercycle spanning 10-15 years.
If his analysis is correct, this supercycle will unfold in waves across multiple cycles, alternating between bull and bear markets.
Currently, we are in a bull market, but bull markets do not last forever.
Looking back at history, Ethereum experienced a 94% decline in 2018 and an 80% decline in 2022, indicating that a significant pullback may still occur in the future.
While we cannot pinpoint when the pullback will happen, by tracking various key indicators, we can reference the levels Ethereum has reached in past cycles to provide insights into future trends.
Key Indicator Analysis and Price Targets
200-week Moving Average
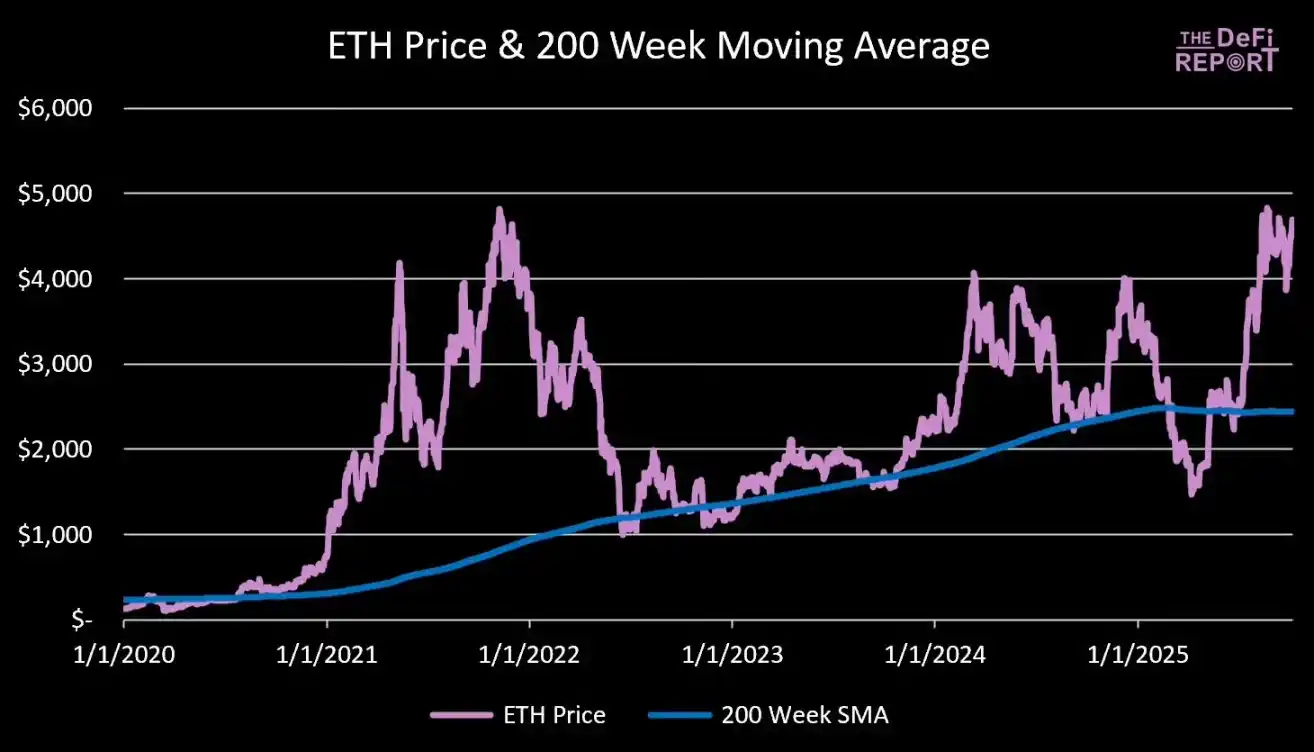
Data Source: The DeFi Report
Currently, Ethereum's trading price is 92% above its 200-week moving average ($2,400).
In the 2021 cycle peak, Ethereum's price was 492% above the 200-week moving average.
Scenario Analysis:
· 200% above the 200-week moving average: Ethereum price at $7,300
· 250% above the 200-week moving average: Ethereum price at $8,500
· 300% above the 200-week moving average: Ethereum price at $9,800
· 350% above the 200-week moving average: Ethereum price at $11,000
· Above the 200-Week Moving Average by 400%: Ethereum Price at $12.2K
Note: The 200-week moving average is a dynamic metric, but over time, we are gradually replacing price data from Ethereum's price range of $3,000 to $4,000 about 4 years ago. Therefore, it is expected that by the end of this year, the fluctuation of the 200-week moving average will be very small.
Ethereum Price to Realized Price Ratio
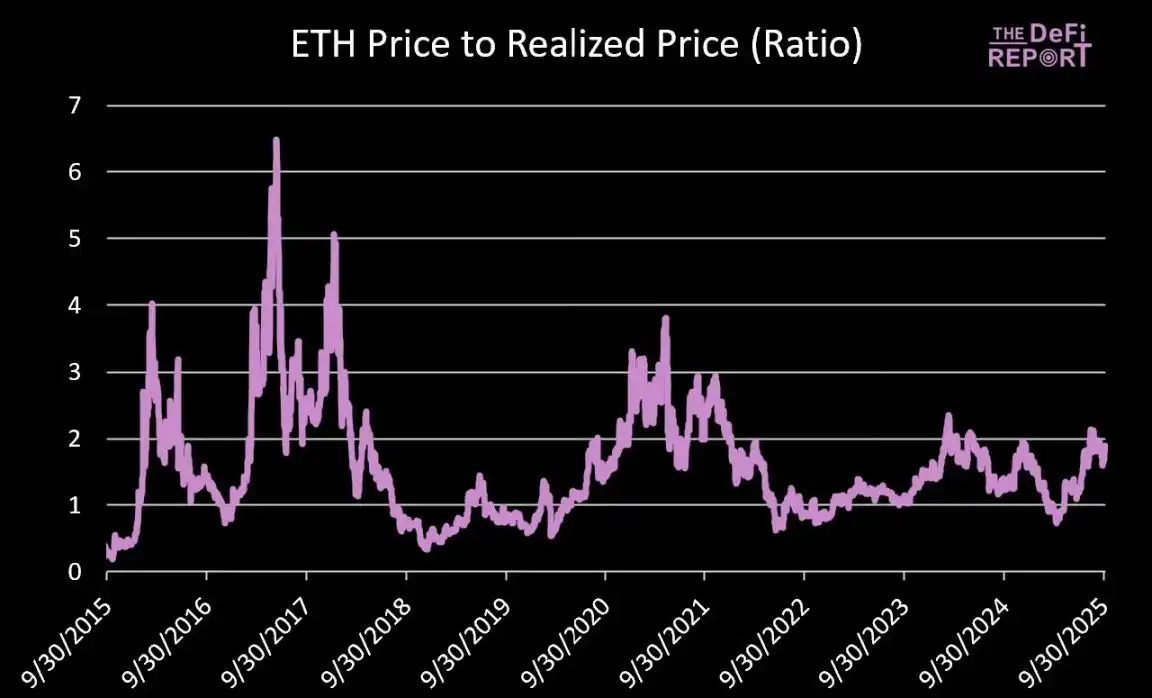
Data Source: The DeFi Report, Glassnode
The realized price can serve as an alternative metric for the cost basis. Since January 1, 2017, the average ratio of Ethereum price to realized price has been 1.6. The current ratio is 1.9.
During the 2017 cycle, this ratio peaked at 5; in the 2021 cycle, the peak ratios were 3.5 in April and 2.9 in November.
Scenario Analysis (assuming a ratio of 2.9):
· If the realized price is $3,000: Ethereum price would be $8,700
· If the realized price is $3,500: Ethereum price would be $10.2K
· If the realized price is $4,000: Ethereum price would be $11.6K
MVRV Z-Score
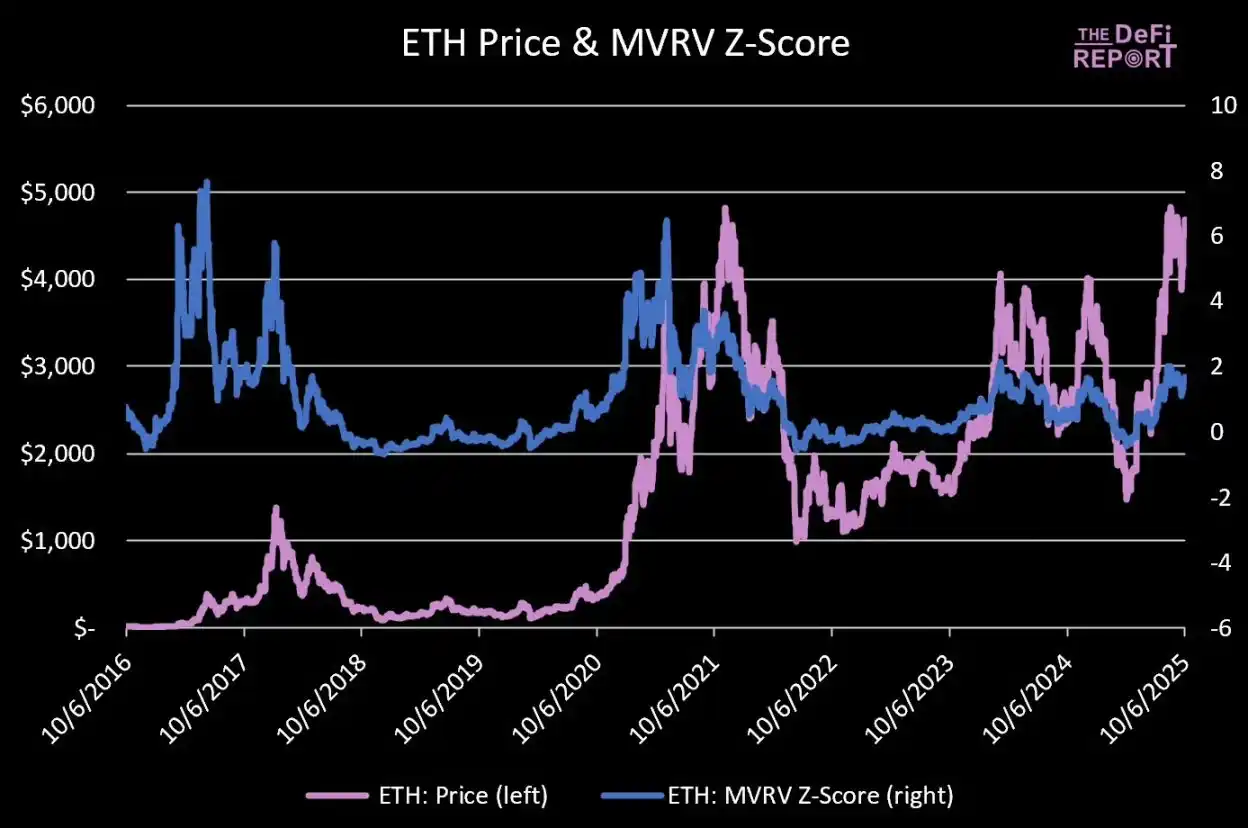
Data Source: The DeFi Report, Glassnode
The Z-score is used to measure how many "volatility units" the market value is above or below the on-chain cost basis. A higher Z-score indicates an overheated market; a negative Z-score indicates an undervalued market.
Since January 1, 2017, Ethereum's average Z-score has been 0.99, indicating an overall market bias towards optimism.
The current Z-score is 1.66, which, while above the historical average level, has not yet reached an overheated state.
During the 2021 cycle, the Z value peaked at 6.5 in April and 3.48 in November.
Scenario Analysis:
· If the Z value is 2.21: Ethereum price is $7000
· If the Z value is 2.77: Ethereum price is $8000
· If the Z value is 3.33: Ethereum price is $9000
· If the Z value is 3.9: Ethereum price is $10,000
Note: Assuming by the end of this year, the realized price has increased by 22% (to $3000). For reference, the realized price has increased by 24% from April of this year to date.
Ethereum to Bitcoin Market Cap Ratio
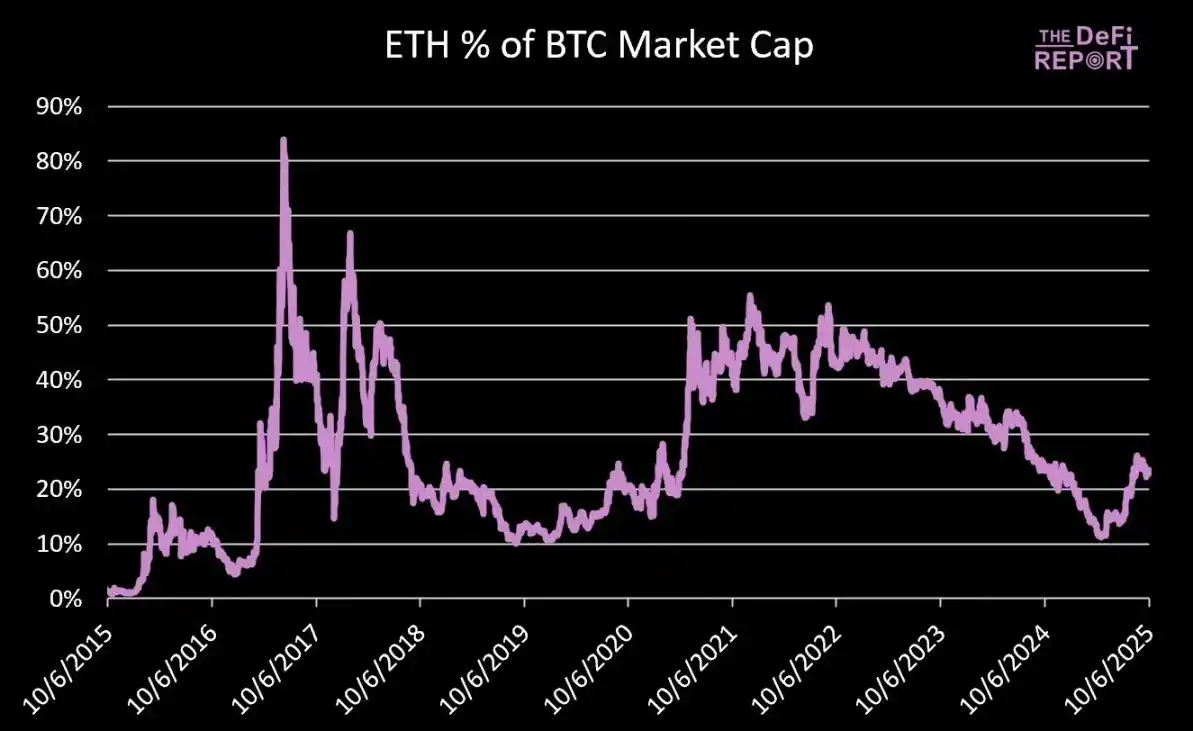
Data Source: The DeFi Report
Currently, Ethereum's market cap is approximately 23.4% of Bitcoin’s market cap.
In November 2021, Ethereum's market cap reached 55.5% of Bitcoin's market cap.
If Bitcoin's price reaches $150,000 (a 23% increase from the current), its market cap will reach $3 trillion.
Scenario Analysis:
· If Ethereum's market cap is 35% of Bitcoin's market cap: Ethereum's total market cap is $1.05 trillion, corresponding to a price of $8658
· If Ethereum's market cap is 45% of Bitcoin's market cap: Ethereum's total market cap is $1.35 trillion, corresponding to a price of $11,132
· If Ethereum's market cap is 55% of Bitcoin's market cap: Ethereum's total market cap is $1.64 trillion, corresponding to a price of $13,559
The key question is whether Bitcoin will experience a significant increase. Compared to the last cycle, will Ethereum's increase relative to Bitcoin be moderate or explosive?
Ethereum to Nasdaq Index Ratio
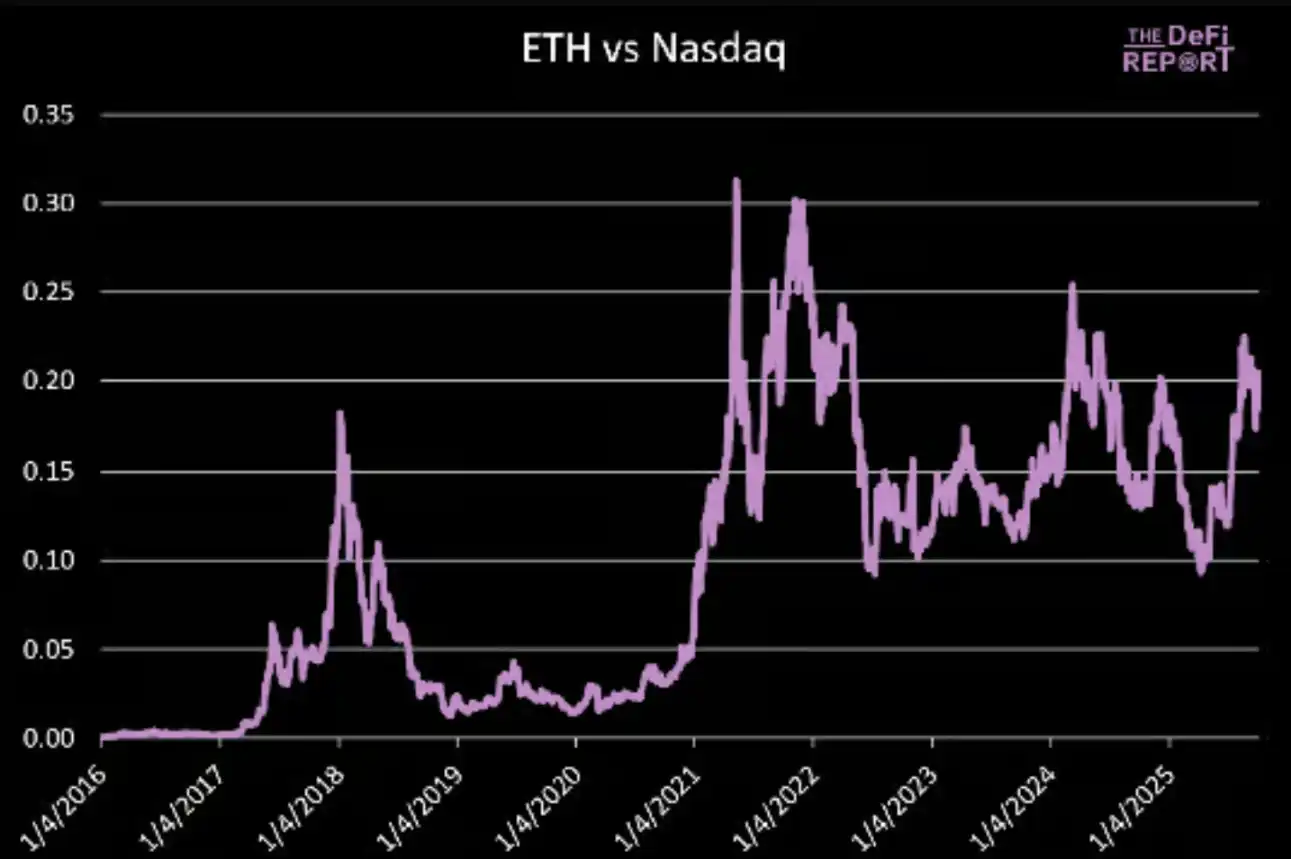
Data Source: The DeFi Report
In May and November 2021, the Ethereum to Nasdaq Index ratio peaked at 0.31 and 0.30, respectively.
The current ratio is 0.20, with the Nasdaq Index currently at 22788 points.
If the Nasdaq Index were to rise by 5% by the end of the year (a 23% year-to-date increase), its level would reach 23927 points.
Ethereum Price Scenario Analysis:
· If the ratio is 0.25: Ethereum price would be $5981
· If the ratio is 0.30: Ethereum price would be $7178
· If the ratio is 0.35: Ethereum price would be $8374
· If the ratio is 0.40: Ethereum price would be $9570
Our baseline assumption is that the trend of Ethereum's ratio to the Nasdaq Index rising with the cycle will continue, and the ratio will hit a new high this cycle (exceeding 0.30).
Summary
Our key assumptions are as follows:
· Ethereum price is 250% above the 200-week moving average, corresponding to a price of $8500;
· Realized price reaches $3000, with a realized price ratio of 2.9, corresponding to an Ethereum price of $8700;
· Ethereum's market cap reaches 35% of Bitcoin's market cap, with a Bitcoin price of $150,000, corresponding to an Ethereum price of $8600;
· Ethereum's ratio to the Nasdaq Index hits a new high, with a ratio of 0.35, corresponding to an Ethereum price of $8300.
If the bull market continues, Ethereum's price could surpass $10,000; if the market turns bearish and Bitcoin's peak increase is limited, Ethereum will also come under pressure.
Meanwhile, as market sentiment heats up, there is increasing discussion about a "cycle extension," reminiscent of the prevailing "super cycle" narrative of 2021.
As previously mentioned, the baseline assumption remains: Ethereum will reach its cycle peak this quarter.
Disclaimer: The content of this article solely reflects the author's opinion and does not represent the platform in any capacity. This article is not intended to serve as a reference for making investment decisions.
You may also like
Can the 40 billion bitcoin taken away by Qian Zhimin be returned to China?
Our core demand is very clear—to return the assets to their rightful owners, that is, to return them to the Chinese victims.

Bitcoin Surges but Stumbles: Will Crypto Market Recover?
In Brief Bitcoin fails to maintain its position above $93,000 and faces heavy selling pressure. Altcoins experience sharp declines, with some showing mixed performance trends. Shifts in U.S. spot Bitcoin ETF flows highlight cautious investor behavior.

Qubic and Solana: A Technical Breakthrough by Studio Avicenne