Key to the BearWhale Transformation: The Second S-Curve of Growth

The second-order S growth curve is the result of normalizing the financial's structure under actual constraints through yield, labor, and trustworthiness.
Original Title: The Second S-Curve
Original Author: arndxt, Crypto Analyst
Original Translator: AididiaoJP, Foresight News
Liquidity expansion remains the dominant macro narrative.
Recession signals lag, structural inflation exhibits stickiness.
Policy rates above neutral levels but below tightening thresholds.
Markets are pricing in a soft landing, but the real adjustment is institutional: from cheap liquidity to restrained productivity.
The second curve is not cyclical.
It is the structural normalization of finance under actual constraints through yield, labor, and credence.
Cyclical Transformation
The Token2049 Singapore conference marks a turning point from speculative expansion to structural consolidation.
Markets are repricing risk, shifting from narrative-driven liquidity to income-backed yield data.
Key transitions:
· Perpetual decentralized exchanges maintain dominance, with Hyperliquid ensuring network-scale liquidity.
· Prediction markets are emerging as functional derivatives of information flow.
· AI-related protocols with real Web2 use-case scenarios are quietly expanding revenue.
· Re-staking and DAT have peaked; liquidity decentralization is evident.
Macro Institutional: Currency Devaluation, Demographics, Liquidity
Asset inflation reflects currency devaluation, not organic growth.
During liquidity expansion, duration assets outperform the broad market.
During liquidity contraction, leverage and valuations are compressed.
Three structural driving factors:
· Currency Debasement: The repayment of sovereign debt requires continued balance sheet expansion.
· Demographic Structure: Population aging reduces productivity and strengthens reliance on liquidity.
· Liquidity Pipeline: Global total liquidity, i.e., the sum of central bank and banking system reserves, has tracked 90% of risk asset performance since 2009.
Recession Risk: Lagging Data, Leading Signals
Mainstream recession indicators are lagging.
CPI, unemployment rate, and the Sam Rule will only confirm an economic downturn after it has begun.
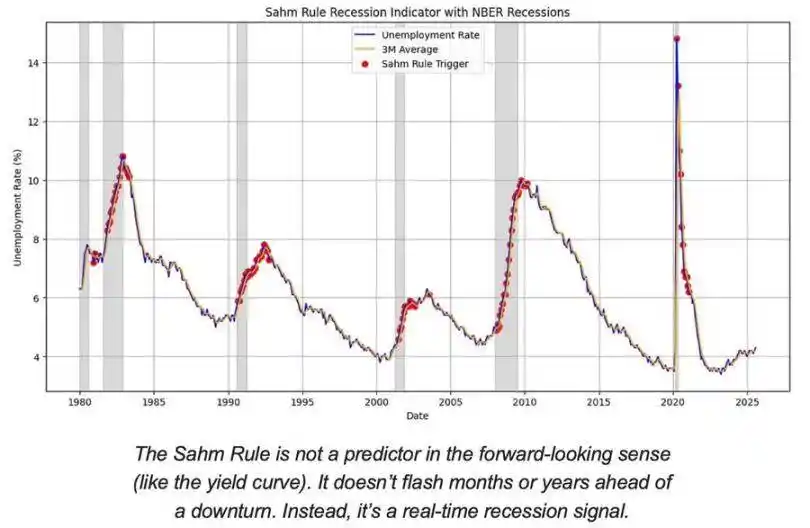
The U.S. is in the late stage of the economic cycle, not a recessionary phase.
The likelihood of a soft landing remains higher than the risk of a hard landing, but policy timing is a constraining factor.
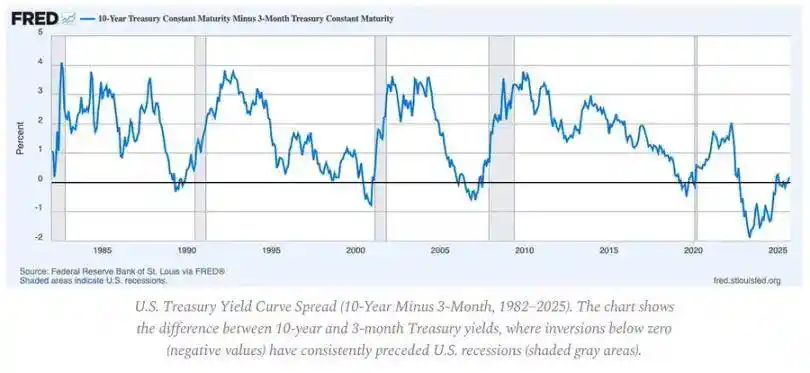
Leading Indicators:
· Yield curve inversion remains the clearest leading signal.
· Credit spreads are under control, indicating no imminent systemic pressures.
· The labor market is gradually cooling off; employment remains tight within the cycle.
Inflation Dynamics: The Last Mile Issue
The commodity anti-inflation has completed; service inflation and wage stickiness now anchor overall CPI around 3%.
This "last mile" represents the most complicated phase of anti-inflation since the 1980s.
· Commodity deflation now offsets some CPI impact.
· Wage growth near 4% keeps service inflation elevated.
· Housing inflation lags in measurement; real market rents have cooled off.
Policy Implications:
· The Fed faces a trade-off between credibility and growth.
· Premature rate cuts pose the risk of accelerating again; prolonged maintenance carries the risk of over-tightening.
· The equilibrium outcome is a new inflation floor near 3%, not 2%.
Macroeconomic Structure
Three long-term inflation anchors still exist:
· Deglobalization: Supply chain diversification has increased the cost of transformation.
· Energy Transition: Capital-intensive low-carbon activities have raised short-term investment costs.
· Demographic Structure: Structural labor shortages have led to persistent wage rigidity.
These factors have constrained the Federal Reserve's ability to normalize without higher nominal growth or higher sustained inflation.
Disclaimer: The content of this article solely reflects the author's opinion and does not represent the platform in any capacity. This article is not intended to serve as a reference for making investment decisions.
You may also like
Alphabet’s TPUs Emerge as a Potential $900 Billion Chip Business
Ethereum Loses 25% of Validators After Fusaka: The Network Nears a Critical Failure
US Stablecoin Rules Are Splitting Global Liquidity, CertiK Warns
JPMorgan Sees Bitcoin Reaching $170K if Strategy Holds Firm