
Bitcoin Weekly Watch|This Week’s Profit and Loss Scenario Is Already Set! Just Waiting for This Signal…

I. Bitcoin Weekly Market Review (10.13~10.19)
• Trend: Slight rally and pullback → unilateral decline → slight stabilization
• Opening price: 115,089 points
• Lowest price: 103,530 points (Friday)
• Highest price: 116,035 points (Monday)
• Closing price: 108,684 points
• Weekly change: Down 5.57%, maximum amplitude 12.08%
• Trading volume: $18.899 billions
• Technicals: The weekly K-line closed with a large bearish candle with a lower shadow, breaking below the 5-week and 10-week moving averages
Bitcoin weekly K-line chart: (Momentum Quantitative Model + Sentiment Quantitative Model)
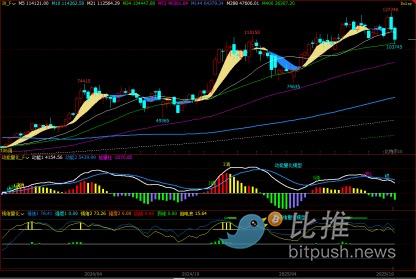
Figure 1
Bitcoin daily K-line chart:
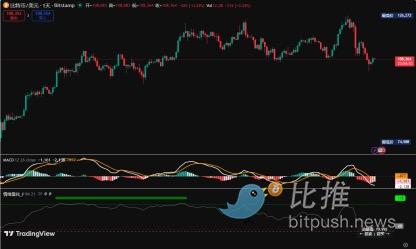
Figure 2
Bitcoin 4-hour K-line chart:
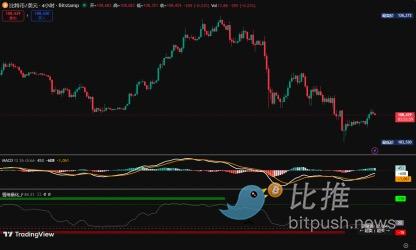
Figure 3
In the weekly review on October 14, the author predicted:
1. This week, the price will retest the effectiveness of the breakdown in the 116,500~118,000 point area. If it encounters resistance and falls back, the price will maintain a range-bound trend.
2. Resistance levels: The first resistance is between 116,500~118,000 points, the second resistance is around 123,000 points.
3. Support levels: The first support is between 107,000~108,500 points, the second support is around 105,000 points.
The trading strategy given in the October 12 weekly review was:
1. Medium-term strategy: For the latest position-building method, please refer to the link at the bottom of the article.
2. Short-term strategy: Control position size, set stop-loss points, and trade based on resistance and support levels to achieve "sell high, buy low." (Use 60-minute/240-minute as the trading cycle).
• This strategy uses the result of the price test of the key 116,500~118,000 point area as the decision basis;
• If the price stabilizes again in this area: plan to go long after a stabilization signal appears, set stop-loss near 116,500 points, the first target is around 123,000 points, close the position if resistance is encountered.
• If the price effectively breaks below this area: plan to go short after a resistance signal appears, set stop-loss near 118,000 points, the first target is around 108,000 points, close the position if it stabilizes.
Review of the actual trend this week:
This week, Bitcoin showed an overall trend of "rally and pullback—unilateral decline—stabilization and rebound." Specifically, at the beginning of the week, the price opened flat and moved up, hitting 116,035 points before encountering resistance and falling back, with the daily line closing as a doji with a slight 0.15% gain; from Tuesday, the market turned, with four consecutive trading days of unilateral decline, with daily drops between -1.60% and -2.34%. On Friday, after dropping to 103,530 points, the price rebounded from the bottom, closing down 1.60%, with a long lower shadow on the daily line, signaling an initial halt to the decline. The following two days saw consecutive gains, forming an oversold technical rebound. This week's trend was basically consistent with the author's previous prediction of "rally encountering resistance and pullback, maintaining range-bound movement."
Review of trading strategies this week:
• Medium-term strategy: Based on the author's prediction of "range-bound movement," since a unilateral trend did not form, the strategy was to stay on the sidelines and not trade this week.
• Short-term strategy: This week, trades were executed according to the author's established short-term strategy, and profits were successfully realized and exited.
Based on this week's market performance, the author will comprehensively use multiple technical frameworks to conduct an in-depth analysis of the internal structure evolution of Bitcoin.
1. As shown in Figure 1, from the weekly chart perspective:
• Momentum Quantitative Model: After this week's adjustment, both momentum lines moved downward simultaneously, the gap widened, and the energy (green) bars grew rapidly.
Model indicates price decline index: accelerated adjustment
• Sentiment Quantitative Model: Both sentiment indicators have a strength of 0, with a peak value of 0.
Model indicates price pressure index: neutral
• Digital Monitoring Model: No digital signals displayed yet.
The above data suggest: bearish signals are strengthening at the weekly level.
2. As shown in Figure 2, from the daily chart analysis:
• Momentum Quantitative Model: After Friday's close, both momentum lines are below the zero axis, and the energy bars are gradually increasing.
• Sentiment Quantitative Model: After Sunday's close, both sentiment indicators are around 18.
The above data suggest: the daily level has turned into a bear market.
II. Market Forecast for Next Week (10.20~10.26)
1. Looking ahead to next week, the price will rebound to test the key area of 114,000~116,000 points, and the outcome will determine the future direction:
• If it encounters resistance and falls back, it will retest the 103,000 point support, and the trend will remain weak and range-bound.
• If it successfully stabilizes above this area, it will gain upward momentum and is expected to challenge the 120,000 point resistance again, entering a strong range-bound trend.
2. Resistance levels: The first resistance area is 114,000~116,000 points, the second resistance is around 120,000 points.
3. Support levels: The first support is around 103,000 points, the second support is around 100,000 points.
III. Trading Strategies for Next Week (Excluding Impact of Unexpected News): (10.20~10.26)
1. Medium-term strategy: Currently, the daily level has turned into a bear market, so the overall trading approach is "bearish." For the latest position-building method, please refer to the link at the bottom of the article.
2. Short-term strategy: Control position size, set stop-loss points, trade based on resistance and support levels, and mainly short on rallies. (Use 60-minute/240-minute as the trading cycle).
• This strategy uses the result of the price test of the key 114,000~116,000 point area as the decision basis;
• If the price stabilizes again in this area: do not trade for now.
• If a resistance signal appears in this area, enter short as planned, set stop-loss above 116,000 points, the first target is around 103,000 points, close the position if it stabilizes.
IV. Special Reminders:
1. When opening a position: immediately set the initial stop-loss level.
2. When profit reaches 1%: move the stop-loss to the entry price (break-even point) to ensure no further loss on the trade.
3. When profit reaches 2%: move the stop-loss up to the 1% profit level.
4. Tracking: For every additional 1% increase in price, move the stop-loss up by 1% accordingly, dynamically protecting and locking in existing profits.
(Note: The above 1% profit trigger threshold can be flexibly adjusted by investors according to their own risk preferences and the volatility of the underlying asset.)
The financial market is ever-changing and volatile. The author will dynamically adjust trading strategies at any time. If investors want to receive the latest trading views daily, please follow the "Bitpush TG Group" link at the bottom of the article, where you can read the author's intraday commentary articles and get the latest trading views as soon as possible.
Author: Cody Feng
Disclaimer: The content of this article solely reflects the author's opinion and does not represent the platform in any capacity. This article is not intended to serve as a reference for making investment decisions.
You may also like
Morning Minute: Robinhood Pushes Deeper Into Prediction Markets
SoFiUSD Stablecoin: The Revolutionary First from a US National Bank
VivoPower Plans $300M Ripple Labs Share Vehicle in South Korea
Revealing: Kevin Hassett’s Bold Call for an Interest Rate Cut and What It Means for Crypto