
MSTR has been rated as B grade, is DAT company still worth knowing and investing in?

DAT Connection is Risk, but it could also be the Future
Original Article Title: Narrative Crypto vs Usable Crypto
Original Authors: @0xnoveleader, Castle Labs; @BukovskiBuko3, The Big Whale
Translation: Peggy, BlockBeats
Editor's Note:
As Standard & Poor's (S&P Global) first issued a credit rating for Strategy (formerly MicroStrategy) and rated it as "B-" in the same week, the discussion about "Digital Asset Treasuries (DAT)" also entered a new stage. The significance of this rating far exceeds the company itself, marking the first time the Bitcoin treasury model has been included in the mainstream credit system evaluation framework.
This is both recognition and collision. Standard & Poor's examined Strategy with traditional financial logic, believing that its "asset is Bitcoin, liability is the U.S. dollar" structure suffers from a fundamental currency mismatch; while crypto advocates insist that this is precisely the paradigm shift of a new generation of "asset-based companies."
The DAT model connects risk and may also represent the future. It represents an intermediate zone between crypto and the capital market—neither fully belonging to the "crypto world" nor entirely to the "stock market." Strategy was rated as "junk," but in a sense, this was the first time a digital asset treasury qualified for a rating. In the future, how traditional rating agencies quantify Bitcoin risk and how investors view the "crypto version of Berkshire Hathaway" will determine whether DAT can transition from a speculative narrative to part of the financial structure.
Below is the original text:
Introduction
Digital Asset Treasuries (DATs) are increasingly becoming a mechanism to attract Traditional Finance (TradFi) attention to blue-chip crypto assets (such as $BTC and $ETH). We are witnessing a wave of DAT projects, the core idea of which is to accumulate digital assets as the core asset of a company's treasury.
The DAT model provides investors with a stock-like exposure mechanism to crypto assets—investors do not directly purchase cryptocurrencies but buy the company's stock that holds crypto assets. This model can also be understood as a "crypto asset wrapper" that allows investors to bypass complex self-custody processes and avoid data leaks and social engineering attacks associated with exchanges.
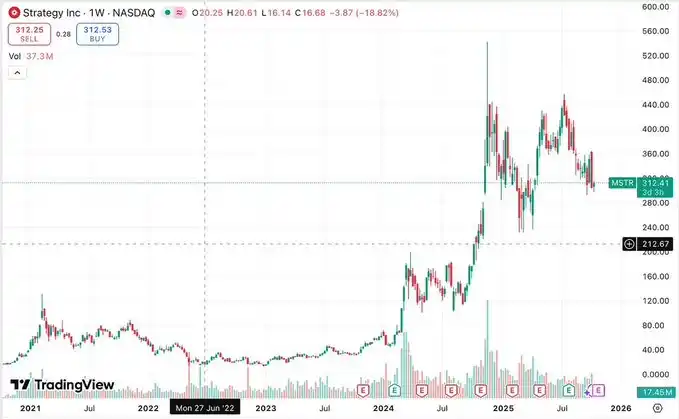
The most representative DAT at present is Strategy (formerly @MicroStrategy), which holds approximately 640,000 bitcoins, accounting for 3% of the total Bitcoin supply. With Strategy's success and the soaring price of its stock ($MSTR), this model has become highly attractive to other companies—they can acquire crypto assets through financing, thereby driving changes in per-share asset backing, triggering market speculation on their net asset value multiple (mNAV) and premium/discount.
This article aims to provide an in-depth analysis of how DAT operates, key metrics, current market landscape, participating companies, potential risks, and ultimately assess its long-term sustainability.
What is DAT? How does it operate?
The term DAT emerged with the transformation of Strategy. Originally a software company providing business analytics services, Strategy rebranded to DAT in August 2020, leading to a more than 2000% surge in its stock price. While part of the reason was becoming the first publicly traded company to make a large-scale Bitcoin purchase, this also validated the DAT model as a viable business opportunity.
At its core, DAT acts as a "equity financing asset accumulation tool," raising funds through stock issuance and acquiring crypto assets to enhance the company's crypto asset exposure on its balance sheet. Its valuation and operational metrics (such as NAV, mNAV, premium/discount) are highly dependent on the price fluctuations of the held assets.
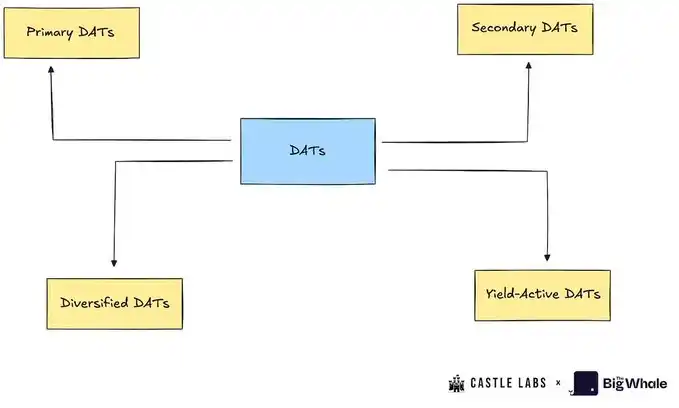
Digital Treasury Companies can be classified into the following categories:
1. Primary Digital Treasury Companies (Primary DATs): These are the most typical digital treasury companies, accumulating specific assets (such as BTC or ETH) through equity financing. Representative companies include Strategy and BitMine.
2. Secondary Digital Treasury Companies (Secondary DATs): These companies do not fully adopt the digital treasury company model but support their stock price through other businesses, leveraging digital assets for diversified exposure. These companies generate revenue through core operations and accumulate crypto assets with part of the income. Representative companies include Tesla, Galaxy, and MARA.
3. Yield-Active Digital Treasury Companies (Yield-Active DATs): These companies aim to generate revenue from their crypto assets. For example, Sharplink stakes most of its ETH and earns staking rewards from it.
4. Diversified Digital Treasury Companies (Diversified DATs): These companies still accumulate crypto assets but do not focus on a single asset, holding multiple assets instead. Representative companies include Nepute Digital Assets Corp (holding BTC, ETH, SOL) and BTCS Inc (holding ETH, ADA, SOL).
While this report will not strictly differentiate between these various types of digital treasury companies, it will select a few as case studies for in-depth analysis.
Key Terminology Analysis for DAT
To better understand the operation of DAT, this section will introduce a series of key terms that are important indicators of a DAT's health.
Net Asset Value (NAV): Refers to the net worth of a DAT treasury, calculated as the quantity of assets in the treasury multiplied by their USD price. For example, if a DAT holds 10,000 BTC (with a price of $114,000 per BTC), then its NAV is $1.14 billion.
Net Asset Value per Share (NAVps): NAV divided by the company's total diluted outstanding shares. This metric reflects the value that each share should have. If the market price is higher than NAVps, it means the company's stock is trading at a premium; otherwise, it is at a discount.
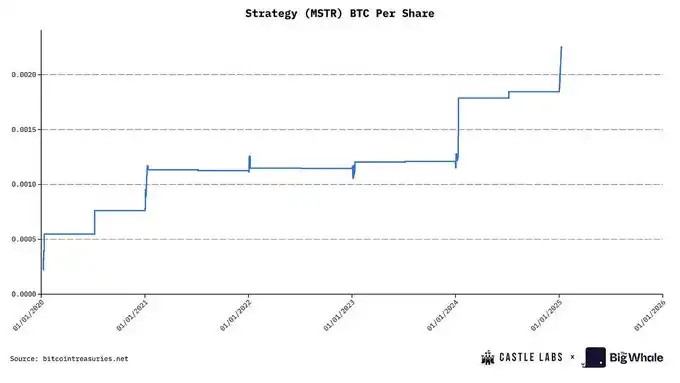
Crypto Asset per Share (CPS): The quantity of crypto assets represented by each share. It measures the amount of BTC, ETH, or other assets that each share corresponds to.
Market Value to NAV Ratio (mNAV): The ratio of the company's market value to its NAV. If mNAV is higher than 1.0, it indicates that the stock price is above the treasury value (investors pay a premium for exposure to crypto, leverage, or options); if mNAV is less than 1.0, it suggests market skepticism, governance risks, or insufficient disclosure, leading to a discount.
Accretion/Dilution Test: Issuance is only beneficial to investors when the quantity of crypto assets purchased with newly issued shares exceeds the current CPS (accretion). The formula is as follows: ΔUΔS>US\frac{ΔU}{ΔS} > \frac{U}{S}ΔSΔU>SU
Where:
ΔU: Quantity of newly purchased crypto assets
ΔS: Quantity of newly issued shares
U: Quantity of currently held crypto assets
S: Current outstanding shares
For example, if a company plans to raise $10 billion, trades at a 40% premium (mNAV=1.4), holds 200,000 BTC (NAV=$22 billion), has 20 million shares outstanding, and a total market value of $30.8 billion, with a share price of $1,540, the company needs to issue approximately 650,000 shares to complete the funding.
After the financing, the company purchased 9,000 BTC at a price of BTC$110,000 per BTC, increasing the treasury's total holdings to 209,000 BTC. The original CPS was 200,000/20,000,000=0.01, and the new CPS is 209,000/20,650,000≈0.0101, indicating a slight increase in value for investors due to this financing.
DAT Financing Mechanisms
DAT can fund its treasury through various means, including:
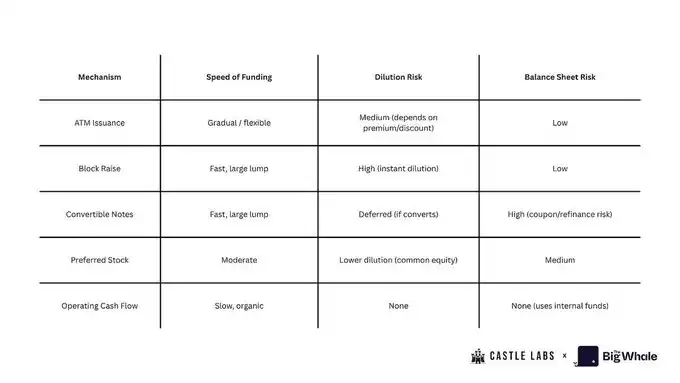
1. Market Issuance (ATM Issuance)
The company establishes an At-The-Market issuance plan with an investment bank to gradually sell shares in the market and use the funds raised to purchase crypto assets. This method is suitable when the stock trading price is higher than NAV. It is a flexible, low-friction financing tool, but excessive usage may lead to dilution of shareholder equity.
2. Block Raises / Secondaries
The company issues a large number of shares at once and sells them to investors at a slightly lower price than the market price to facilitate significant crypto asset purchases. This method can quickly replenish the treasury but may cause short-term dilution.
3. Convertible Notes
The company issues bonds with a fixed interest rate, maturity date, and conversion terms (allowing conversion to stock at a set price in the future). This method can raise funds without immediate shareholder dilution. However, if the stock price rises and remains above the conversion price for an extended period, the company may opt for debt-to-equity conversion, leading to dilution. If the stock price falls, the debt remains as debt, exposing the company to repayment or refinancing risks.
4. Preferred Stock
The company issues preferred stock to raise funds. Preferred stockholders have priority in dividend and liquidation rights over common stockholders, may come with fixed dividends, conversion rights, or special privileges. This method has a lower financing cost compared to issuing common stock but establishes a "seniority" structure that limits the upside potential for common stockholders.
5. Operating Cash Flow (OCF)
The company uses a portion of its operating profits to purchase crypto assets instead of issuing new shares or bonds. This method is the most sustainable and least dilutive way to build the treasury but has a slower accumulation rate.
Current DAT Landscape
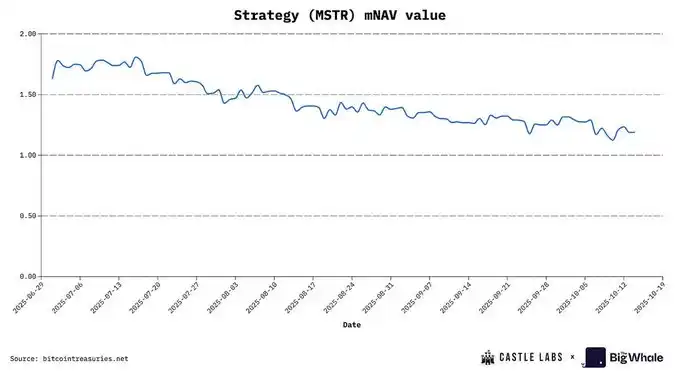
MSTR's mNAV Premium Data Source: BITCOINTREASURIES.NET
The most mainstream financing instruments currently are preferred stock and convertible bonds, favored by hedge funds and institutional investors to hedge against the continuous dilution impact of equity, while maintaining the continuous accumulation of BTC.
Due to the first-mover advantage and the high recognition by global stock market investors (almost entering the S&P 500 index), Strategy has become an industry benchmark, even "too big to compare." This also means that it bears a huge responsibility: once it fails, it may cause a structural shock to stock market and digital asset confidence.
Another important BTC DAT company is @Metaplanet_JP from Japan. The company originally operated in the hotel business and currently holds over 30,823 BTC. It purchases BTC through a very high NAV premium, which at one point during the year was as high as 8 times, meaning that for every $1 of BTC held, it could finance $8. One of the reasons for such a high premium is its listing on the Tokyo Stock Exchange. Compared to the Nikkei Index, Metaplanet's volatility is higher, providing ordinary Japanese stock market investors with BTC exposure.
Now let's take a look at the development of ETH DAT.
BitMine was originally a Bitcoin mining company focused on immersion cooling data centers, which transformed into an ETH treasury company in July 2025. Following closely is Sharplink, a company specializing in sports betting marketing technology, now the second-largest ETH DAT. These two companies together hold over 3.87 million ETH, with a total value exceeding $15 billion. The earnings per share (EPS) are 189.1% for BitMine and 98.5% for Sharplink, respectively.
Similar to Metaplanet, these two companies also prefer to use ATM equity financing strategies, selling shares when a premium exists, effectively raising funds without relying on dilutive bulk issuance or debt financing, achieving appreciation of each cryptographic asset unit. Once the premium disappears, with mNAV below 1, it leads to dilution and consequently reduces the value of each cryptographic asset unit. Currently, Sharplink's mNAV is 0.92x, slightly at a discount; BitMine's mNAV is 1.18, with a premium of about 18%.
One major advantage of ETH DAT is the ability to earn native rewards by staking ETH. This is an automated mechanism that increases the amount of ETH per share. In addition, staking rewards can be used to boost the Annual Percentage Yield (APY), such as investing in DeFi protocols or share buybacks, a strategy adopted by Sharplink to offset the dilution effect of the ATM strategy.
Apart from MSTR, most DAT companies are still in the early stages. Their aggressive capital-raising behavior reflects their desire to act quickly in the bull market, seizing the opportunity presented by the convergence of the equity market with the digital asset market.
Risks of the DAT Model
The core feature attracting funds into DAT stocks is their "multiple of net asset value" (mNAV). Speculators flock to these stocks, hoping to buy in before the price of crypto assets rises, aiming to achieve returns of 1.5 to 7 times their investment for every dollar invested. However, there is a key issue here: investors are not directly buying Bitcoin or Ethereum through these companies but are purchasing a "volatility wrapper" whose entire value is determined by the mNAV of the DAT currently being traded. Therefore, such investments come with significant risks, and market participants must remain vigilant.
One of the primary risks of the DAT model comes from its business mechanism for accumulating BTC and ETH. The most direct factor affecting stock prices is ongoing equity dilution. From 2022 to the end of 2024, Strategy dilutes shareholders by an average of 45.88% per year; Metaplanet's equity dilution rate is expected to reach 98% by the end of this year. In comparison, BitMine and Sharplink also have high dilution rates of 24.25% and 11.4%, respectively, mainly due to their use of the ATM model to purchase ETH. Sharplink's dilution rate is calculated quarterly (Q1 to Q2), while BitMine's dilution rate is based on its fully diluted estimate under the current stock price from its $25 billion ATM plan.
Since operational cash flow is negative (MSTR's second-quarter operational cash flow was -$34 million, Sharplink was -$1.62 million), DAT companies typically choose the ATM mode to purchase crypto assets. However, this method is only effective when there is a premium in the market; once a discount appears, the company will be unable to sustain its purchasing pace, leading to a stagnation of the per-share crypto asset unit and further triggering investor selling pressure.
To avoid ongoing dilution, MSTR and other companies choose to finance through issuing convertible bonds. Convertible bonds are usually purchased by hedge funds, which employ a "Delta-neutral strategy" because convertible bonds contain OTM (out-of-the-money) options. The funds establish short positions, creating continuous selling pressure.
Meanwhile, a rise in stock price will increase the bond's value as the OTM option appreciates. The bond also comes with a small annual interest, further enhancing returns. As the stock price approaches the conversion price, the bond's Delta increases, and its value rises accordingly.
Conversely, when the stock price falls, hedge funds can not only profit from short positions but also, due to BTC holdings and excess collateralization of common stock, the bond value does not plummet rapidly, creating an "option protection," namely the bond's convexity.
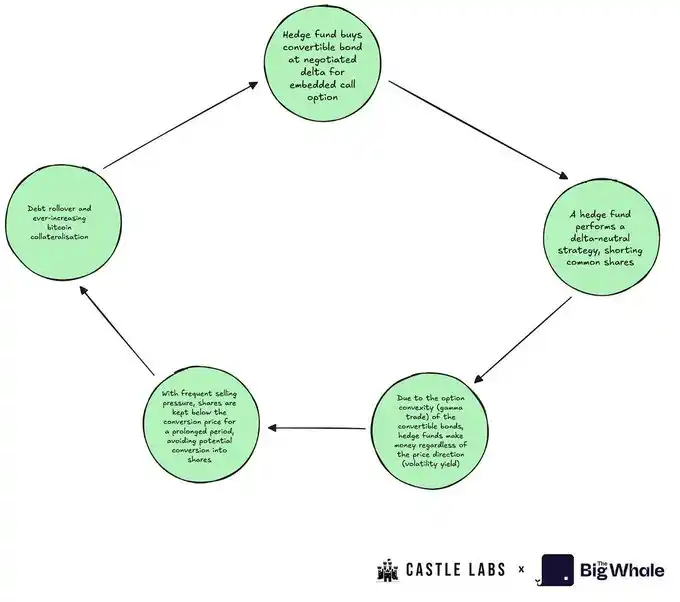
Ultimately, convertible bond holders often prefer not to convert to stock: they hold the largest BTC allocation in the event of a company's bankruptcy and can benefit from long-term volatility gains. The ideal scenario for hedge funds is debt extension— as long as the actual volatility of common stock is high enough to support intense price swings (requiring buyer speculation), they will continue to hold the convertible bonds.
The third financing method is issuing preferred stock. This strategy, pioneered by Strategy, aims to hedge dilution without significantly increasing debt. Preferred stock typically offers annual dividends, but since DAT companies often have negative or very low cash flow, this further undermines their profitability.
Moreover, there are other risks worth noting, including inadequate treasury transparency, stock buyback execution risk (lack of revenue or working capital), liquidity risk during emergency sell-offs, and continuous insider selling of stocks, all of which collectively exert significant pressure on stock prices.
Recently, we have seen a sharp decline in the market capitalization of these DAT stocks: MSTR has fallen by 44%, and Metaplanet has dropped by over 70%. These risks have been adequately priced in by the market, indicating that the DAT model may be losing momentum, and also explaining why, in the current bull market phase, DAT's performance is not as strong as its held cryptocurrency assets.
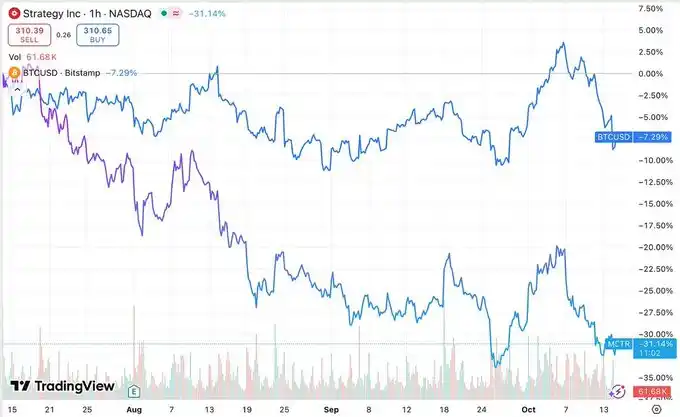
Strategy vs BTC Performance in the Last Three Months
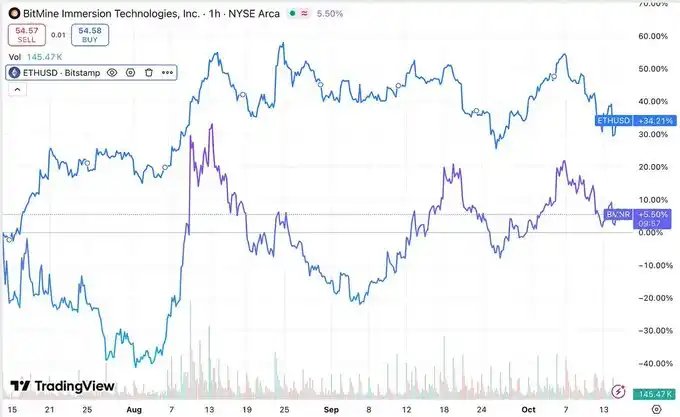
BitMine vs ETH Performance in the Last Three Months
Can DAT Surpass BTC and ETH?
Using Ethereum as a treasury asset allows DAT companies to earn approximately 3.18% annualized yield through staking, helping to enhance the per-ETH metric. However, even with the most mature DeFi protocols in use, significant time is still needed for DAT to significantly boost the per-ETH metric, while also introducing counterparty risk. Although staking and yield farming can generate cash flow for ETH and other altcoin-type DATs, at the current scale, these returns remain limited, making substantial help challenging. To truly build a self-sustaining ETH treasury flywheel, companies must accumulate sufficient funds to generate high yields, cover all expenses, and enhance shareholder value.
As for profit-seeking DATs (such as ETH DAT) outperforming BTC DAT, the key lies in the market's preference for the underlying assets. Currently, the market shows a stronger preference for BTC DAT, especially with MSTR's mNAV exhibiting more stability and stickiness compared to BMNR and SBET.
The market has started to price in risks associated with these assets, resulting in noticeable performance gaps in Q3 between various DATs and BTC or ETH, where the underlying assets outperformed their equity wrappers.
Due to the core business model of DATs being the acquisition of underlying assets, their intrinsic value is difficult to surpass the net asset value of the held assets. Coupled with continuing operational cash flow losses, dividend pressures, and increasing debt levels, these are the primary reasons for the continuing decline in the multiples of most DATs at present.
Before making investment decisions, investors often need to weigh the opportunity cost of capital allocation. Here is a simplified example demonstrating the specific manifestation of this opportunity cost:
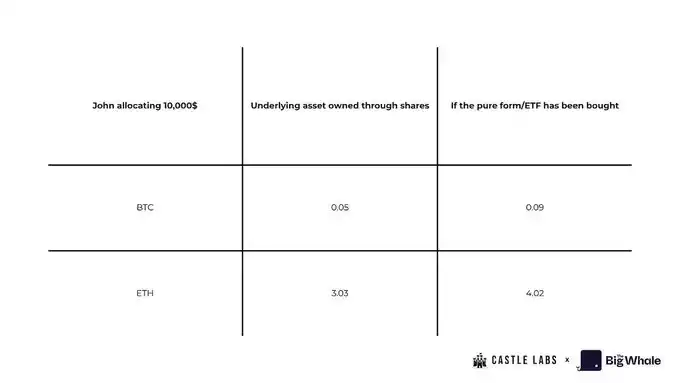
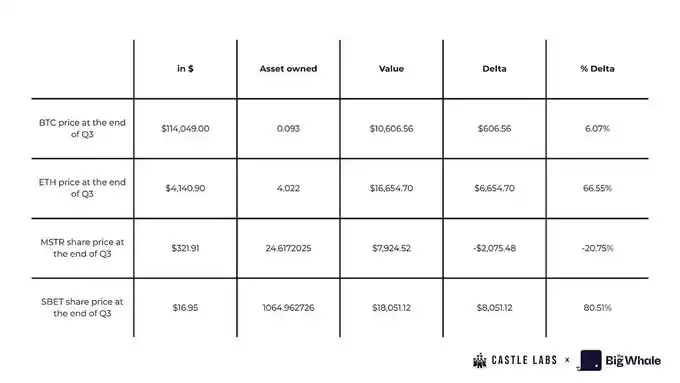
John plans to invest $10,000, considering either directly purchasing BTC and ETH spot or ETF at the end of Q2, or buying MSTR or SBET stocks.
If John chooses to invest the full $10,000 in spot, he will receive: approximately 0.093 BTC (calculated at the Q2 closing price); over 4 ETH (calculated at the Q2 closing price)
If he opts to buy MSTR and SBET stocks instead, he will receive: 24.61 shares of MSTR; 1,064.96 shares of SBET (calculated at the prices on June 30)
Multiplying the number of shares by the current per-share equivalent of BTC, John will hold about 0.04 BTC less than if he had purchased spot directly, and the worst part is that he only holds MSTR stock instead of Bitcoin. Similarly, if purchasing SBET stock, he will be short of a whole 1 ETH compared to directly buying spot.
However, it is worth noting that if John does not sell any stocks by the end of Q3, he will profit approximately $8,000 on his Sharplink stock, as its price has increased by 80%, outperforming the returns of spot and ETFs. On the other hand, he incurred a loss of about -20.75% on his MSTR stock, translating to a loss of the original portfolio value.
The opportunity cost of DAT is not only high, but retail investors also ultimately do not truly own the underlying asset. Once a company goes bankrupt, the claim to the underlying asset belongs to creditors and preferred stock shareholders. This seriously questions the sustainability of DAT as a long-term investment tool.
However, there is still one attractive differentiating factor that attracts funds: DAT offers the possibility of amplified returns, making it more speculative compared to holding spot or ETF, as demonstrated by Sharplink stock's performance from Q2 to Q3.
Although under FASB accounting standards, DAT's income statement may look good (allowing unrealized gains to be recognized as profit), these gains are still measured at fair value and only convert to free cash flow upon asset sale. In other words, these gains are merely changes in asset value on paper and cannot be converted to actual cash unless realized.
In theory, if a company can use excess cash for lending or create stable income through option contracts, these issues can be mitigated. However, each agreement integration adds counterparty risk, raising doubts about its worth. The market generally believes that once these companies start selling positions, it will be a fatal blow to shareholder confidence.
Sustainability Assessment
While there is no perfect set of assessment metrics to address the volatility of digital asset prices, this section will introduce several key metrics for a comprehensive evaluation of DAT performance.
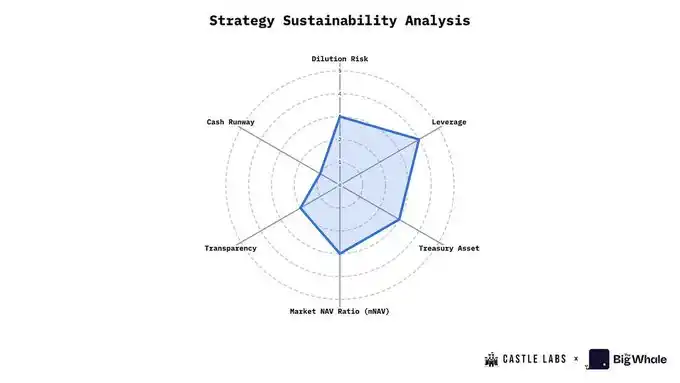
Using Strategy (MSTR) as an example, we will illustrate how to conduct an assessment and scoring. Each metric has a scoring range of 0–5 points:
· Score ≥ 4: The metric performs well
· Score = 3: The metric performs moderately
· Score ≤ 2: The metric performs poorly
· Score = 0: The metric performs extremely poorly
1. Dilution Risk
When new shares issuance affects the existing shareholders' per-crypto-asset unit (CPS), dilution risk arises. If the post-issuance CPS is lower than the current CPS, it is dilution; otherwise, it is appreciation.
The method to evaluate dilution risk is to track CPS changes and compare the pre- and post-financing CPS values.
MSTR: Strategy often uses ATM equity issuance and convertible bond financing to purchase BTC. Since MSTR usually issues equity during stock price premiums (mNAV > 1), it can be considered as "value-accretive dilution." However, its reliance on continuous financing places its dilution risk at a moderately low level. Therefore, we give it 3 points.
2. Leverage Level
Evaluating DAT's leverage level is crucial in tracking its debt instruments used to acquire digital assets, including convertible bonds, collateralized loans, or other similar financing methods.
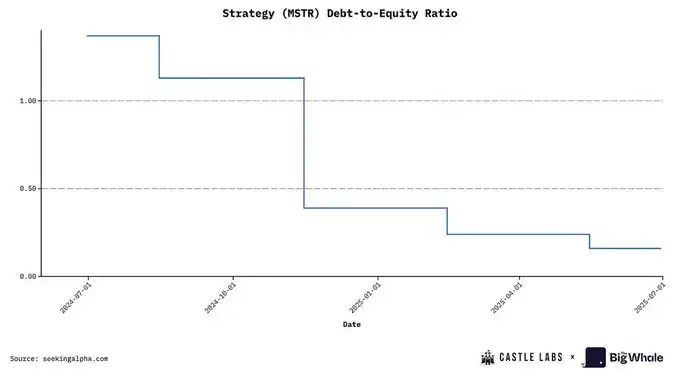
A commonly used metric to measure leverage is the Debt-to-Equity Ratio, used to assess the impact of a significant treasury asset drawdown on the company's leverage level and the potential for a liquidity crisis.
MSTR: Strategy currently has a debt-to-equity ratio of 0.36, at its historical lowest level, classified as low leverage. Therefore, we give it 4 points.
3. Choice of Underlying Asset
The quality of crypto assets held by DAT is key to aligning with investor interests. Most DATs revolve around blue-chip assets such as BTC, ETH, and SOL.
ETH's advantage lies in its sustainable earning potential, which can be used to support company operations or expand treasury holdings. The Cryptocurrency Per Share (CPS) is also an important metric. For example, the current ETH staking annual return is approximately 3%. If a DAT holds $1 billion of ETH, staking alone can generate an additional $30 million in annual revenue. Companies can also choose to participate in more attractive revenue opportunities such as lending or liquidity provision, but this introduces counterparty risk, which Solana DATs also face.
In contrast, BTC does not have active earning potential. Its appeal primarily stems from its positioning as "digital gold" – with limited supply and monetary attributes. An increasing number of companies have included BTC on their balance sheets, reflecting its growing importance as an asset.
MSTR: Strategy holds BTC, and while its asset status is rising, it currently lacks significant earning mechanisms (which may improve in the future). Therefore, we categorize it as medium and award 3 points.
4. Net Asset Value Multiplier (mNAV)
mNAV is one of the simplest and most effective indicators for evaluating the status of a DAO, calculated as the company's market capitalization divided by its treasury's Net Asset Value (NAV).
MSTR: Strategy's current market cap is $823 billion, with NAV around $700 billion, resulting in a base mNAV of 1.16, diluted to 1.25.
Based on the base mNAV value, we can score as follows: mNAV > 1.2: Score 4 or 5 (Strong performance); 1.0 < mNAV < 1.2: Score 3 (Average performance); 0.8 < mNAV < 1.0: Score 1 or 2 (Below-average performance); mNAV < 0.8: Score 0 (Poor performance)
Therefore, Strategy scores 3 on this metric.
5. Treasury Transparency and Governance
This is a qualitative metric used to assess the quality and frequency of a company's disclosures, reserve proofs, audit history, etc., regarding its treasury. Providing a public address for tracking is also a key consideration.
Some companies avoid public addresses as it may trigger a bank run scenario: Purchases of the company's tokens by the DAO could drive up asset prices, which the market could exploit.
MSTR: Strategy maintains limited transparency in terms of reserve proofs, often criticized by the market. Additionally, its governance structure is complex, involving various instruments such as preferred shares and convertible bonds. Therefore, we give it 2 points.
6. Liquidity and Cash Runway
This is a quantitative metric used to analyze a company's current cash flow situation and whether it would need to sell crypto assets to maintain operations in case of issues.
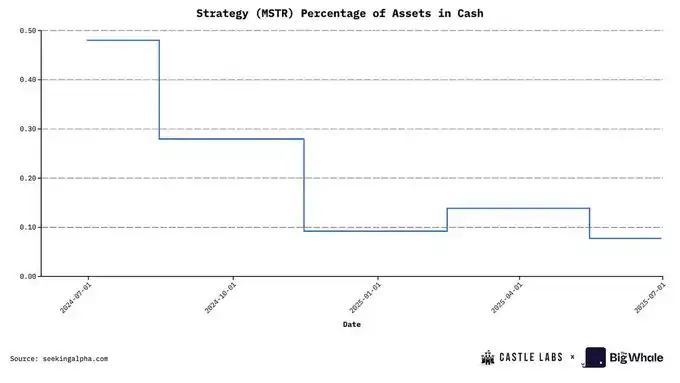
The evaluation method is to divide the company's monthly operating expenses by its cash holdings to assess its cash runway. Having at least a one-year cash runway is considered good practice.
MSTR: Strategy's current cash assets represent only 0.07% of the company's total assets, indicating a very low cash ratio, hence we give it 1 point.
In order to help readers better understand the overall performance of DAT, we have included six key metrics in the evaluation chart, including: Dilution Risk, Leverage Level, Treasury Asset Quality, Modified Net Asset Value (mNAV), Transparency and Governance, Cash Reserves.
Remember: The higher the score, the better the performance of the DAT in that metric (for example, a higher leverage score indicates lower debt levels and a more stable performance).
Taking Strategy as an example, its average score across the six dimensions is 2.83 points (out of 5).
Conclusion
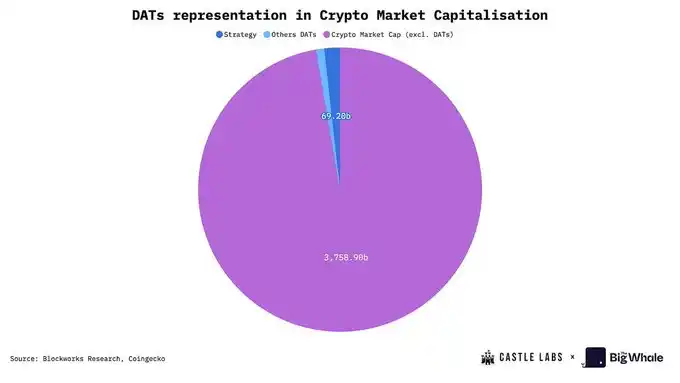
The development of DAT in the industry has been quite significant, with a current Net Asset Value (NAV) of approximately $108 billion, accounting for around 2.5% of the total cryptocurrency market value. This number itself is already substantial, with the largest participant, Strategy, holding 3% of the global Bitcoin supply. In addition to these figures, the DAT model itself is also very attractive, serving as an "equity-fueled asset accumulation tool," allowing traders and institutions to gain exposure without directly holding or trading crypto assets. Its core logic lies in arbitraging the premium or discount of company stocks.
Today, the coverage of DAT has expanded from Bitcoin and Ethereum to other mainstream public chain assets like @Solana. These additional assets have provided more leverage space for DAT, for example, to earn yield through DeFi. These earnings can be used for company operations or improving business metrics. For instance, staking ETH can increase the company's ETH holdings in the treasury, thus enhancing the per-ETH share value, a key metric that investors highly value when evaluating stocks.
The growth of DAT and its key business metrics are highly dependent on the price performance of the held digital assets. During increased market volatility, its mNAV may experience a significant downturn.
Ultimately, the surge in DAT quantity and NAV reflects the increased interest in digital assets from institutions and retail investors, which is a positive signal for the entire industry. However, any investor engaging in such assets should fully understand their potential risks, as described in this report.
Disclaimer: The content of this article solely reflects the author's opinion and does not represent the platform in any capacity. This article is not intended to serve as a reference for making investment decisions.
You may also like
Mars Morning News | The Federal Reserve is expected to cut interest rates on Wednesday, S&P Global assigns a "B-" credit rating to Strategy
S&P Global has assigned a "B-" credit rating to bitcoin treasury company Strategy, classifying it as junk debt but with a stable outlook. The Federal Reserve is expected to cut interest rates by 25 basis points, with a possible split in the voting. The Hong Kong Securities and Futures Commission has launched a tender for a virtual asset trading monitoring system. Citi is partnering with Coinbase to explore stablecoin payment solutions. ZEC surged significantly due to halving and privacy topics. Summary generated by Mars AI. The accuracy and completeness of this summary are still being refined and updated by the Mars AI model.

BTC Volatility Review (October 6 - October 27)
Key indicators (4:00 PM Hong Kong time on October 6 -> 4:00 PM Hong Kong time on October 27): BTC/USD -6.4...

Cathie Wood warns: As interest rates rise next year, the market will be "chilled to the bone"
AI faces adjustment risks!
2025 Trading Guide: Three Essential Trading Categories and Strategies Every Trader Must Know
Clearly identify the type of transaction you are participating in and make corresponding adjustments.