Bitcoin Weekly Watch | Bulls and Bears to Face Off, Direction to Be Decided This Week!

I. Bitcoin Weekly Market Review (10.20~10.26)
• Trend: Surged and pulled back → Slight stabilization → Unilateral rise
• Opening price: 108,683 points
• Lowest price: 106,101 points (Wednesday)
• Highest price: 115,447 points (Sunday)
• Closing price: 114,551 points
• Weekly change: 5.40% increase, maximum amplitude 8.81%
• Trading volume: $15.151 billions
• Technicals: The weekly K-line closed with a large bullish candle, basically "engulfing" last week's bearish candle
Bitcoin weekly K-line chart: (Momentum Quantitative Model + Sentiment Quantitative Model)
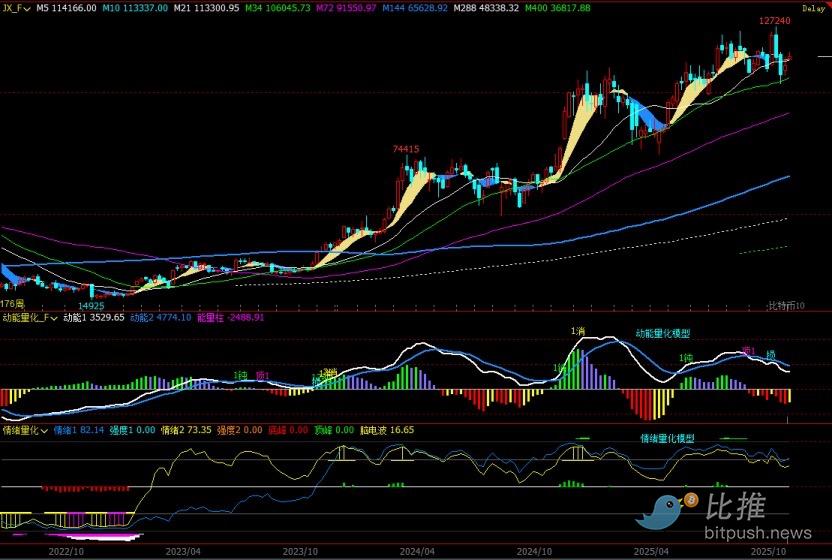
Figure 1
Bitcoin daily K-line chart:
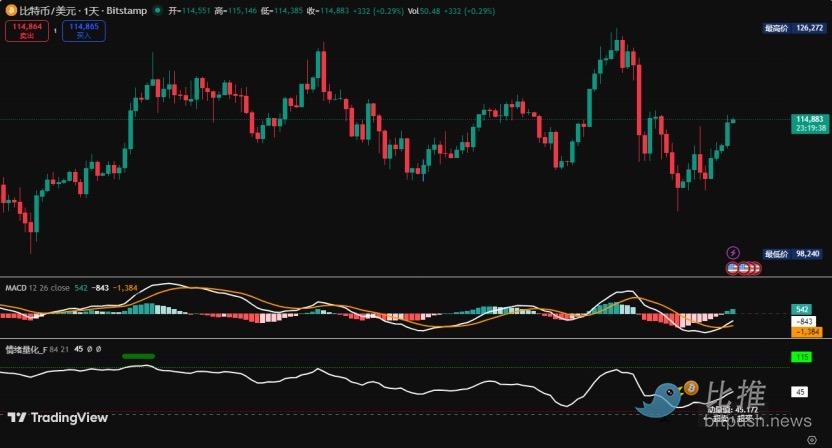
Figure 2
Bitcoin 4-hour K-line chart:
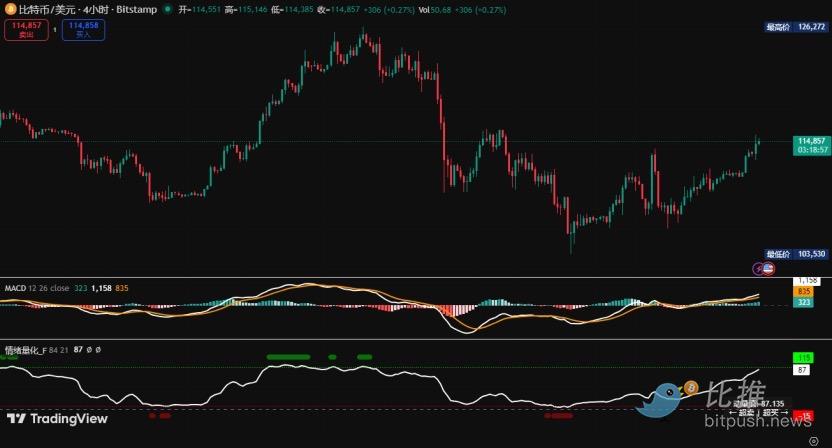
Figure 3
In the weekly review on October 19, the author predicted:
1. Next week, the price will rebound to test the key area of 114,000~116,000 points; if it encounters resistance and falls back, it will test the support at 103,000 points, maintaining a weak range-bound trend.
2. Resistance levels: The first resistance range is 114,000~116,000 points, and the second resistance is around 120,000 points.
3. Support levels: The first support is around 103,000 points, and the second support is around 100,000 points.
The trading strategies given in the October 19 weekly review were:
1. Medium-term strategy: None.
2. Short-term strategy: Control position size, set stop-loss points, and trade based on resistance and support levels to "sell high and buy low." (Using 60-minute/240-minute as the trading cycle.)
• This strategy uses the test result of the key area of 114,000~116,000 points as the decision basis;
• If the price shows resistance signals in this area, enter a short position as planned, set the stop-loss above 116,000 points, target the first level at around 103,000 points, and close the position if stabilized.
Review of actual market movement this week:
This week, Bitcoin overall showed a "surge and pullback, then stabilization and rebound" trend. Specifically, in the first three trading days, the price opened flat and moved higher, rising to the high of 114,088 points before coming under pressure and pulling back, then bottoming at 106,101 points where it found support and gradually stabilized; starting from Thursday, it rebounded for four consecutive trading days, with a cumulative increase of 6.33%. This week's high of 115,447 points closely matched the upper edge of the key area at 116,000 points predicted by the author, precisely validating the effectiveness of this resistance level. The overall rhythm this week basically matched the previous judgment of "maintaining a weak range-bound trend."
Review of trading strategies this week:
• Medium-term strategy: Based on the author's prediction of "maintaining a weak range-bound trend," no trades were made this week.
• Short-term strategy: Trades were executed this week according to the author's established short-term strategy, and profits were successfully realized and exited.
Based on this week's market performance, the author will comprehensively use multiple technical frameworks to deeply analyze the evolution of Bitcoin's internal structure.
1. As shown in Figure 1, from the weekly chart perspective:
• Momentum Quantitative Model: After this week's adjustment, the two momentum lines continued to move downward, and the (negative) energy bars increased.
Model indicates price decline index: in adjustment process
• Sentiment Quantitative Model: Both sentiment indicators have a strength of 0, with a peak value of 0.
Model indicates price pressure index: neutral
• Digital Monitoring Model: No digital signals displayed yet.
The above data suggest: the weekly level is still in an adjustment pattern.
2. As shown in Figure 2, from the daily chart analysis:
• Momentum Quantitative Model: After Sunday’s close, the two momentum lines formed a "golden cross" below the zero axis, and the energy bars turned from "negative" to "positive."
• Sentiment Quantitative Model: After Sunday’s close, both sentiment indicators were around 46.
The above data suggest: the daily level is in an oversold rebound.
II. Market Forecast for Next Week: (10.27~11.02)
1. Currently, the daily level shows a need for an oversold rebound, and the price may continue to rise next week. Continue to observe the 114,000~116,000 points key area, as its outcome will determine the future direction:
• If resistance is encountered and the price falls back, it will test the support at 106,000 points, and the trend will remain in a weak range-bound pattern.
• If the price successfully stands above this area, it is expected to challenge the resistance at 120,000 points again, and the trend will enter a strong range-bound pattern.
2. Resistance levels: The first resistance range is 114,000~116,000 points, the second resistance is around 120,000 points, and the important resistance is around 124,000 points.
3. Support levels: The first support is around 106,000 points, and the second support is around 103,000 points.
III. Trading Strategies for Next Week (excluding the impact of unexpected news): (10.27~11.02)
1. Medium-term strategy: The market is currently in a range-bound pattern, and the trend is not yet clear. For specific position-building methods, please refer to the link at the bottom of the article.
2. Short-term strategy: Control position size, set stop-loss points, and mainly go short at highs based on resistance and support levels. (Using 60-minute/240-minute as the trading cycle.)
• This strategy uses the test result of the key area of 114,000~116,000 points as the decision basis;
• If the price stands above this area again, enter a long position as planned, set the stop-loss around 114,000 points, target the first level at around 120,000 points, and close the position if resistance is encountered.
• If the price shows resistance signals in this area, enter a short position as planned, set the stop-loss around 116,000 points, target the first level at around 106,000 points, and close the position if stabilized.
4. Important time window next week: The Federal Reserve will announce its interest rate decision at 14:00 EST on October 29. Pay attention to market changes.
IV. Special Reminders:
1. When opening a position: immediately set the initial stop-loss level.
2. When profit reaches 1%: move the stop-loss to the entry price (break-even point) to ensure the trade no longer loses money.
3. When profit reaches 2%: move the stop-loss up to the 1% profit level.
4. Tracking: For every additional 1% increase in price, move the stop-loss up by 1% accordingly, dynamically protecting and locking in existing profits.
(Note: The above 1% profit trigger threshold can be flexibly adjusted by investors according to their own risk preferences and the volatility of the underlying asset.)
The financial market changes rapidly, and the market fluctuates greatly. The author will dynamically adjust trading strategies at any time. If investors want to get the latest trading views every day, please follow the "Bitpush TG Group" link at the bottom of the article, where you can read the author's daily intraday commentary articles and get the latest trading views in real time.
Author: Cody Feng
Disclaimer: The content of this article solely reflects the author's opinion and does not represent the platform in any capacity. This article is not intended to serve as a reference for making investment decisions.
You may also like
DOGE Whales Dump 500M Coins in Major Weekly Sell-Off

The Big Reversal Is Loading — 5 Altcoins Showing 10x Potential as Bullish Momentum Builds

All Eyes on CPI — 5 Altcoins Ready to Explode 100x If Risk Appetite

Analyst Predicts the Next Big Move for SHIB After a Long Dormant Phase