Date: Tue, Nov 04, 2025 | 03:54 PM GMT
The cryptocurrency market continues to experience heightened volatility as both Bitcoin (BTC) and Ethereum (ETH) recorded declines of over 2%, putting pressure on major altcoins — including XRP.
While XRP has slipped over 2% today, beneath the bearish tone, the chart is showing something potentially more optimistic — a developing harmonic pattern that could hint at a short-term bullish reversal.
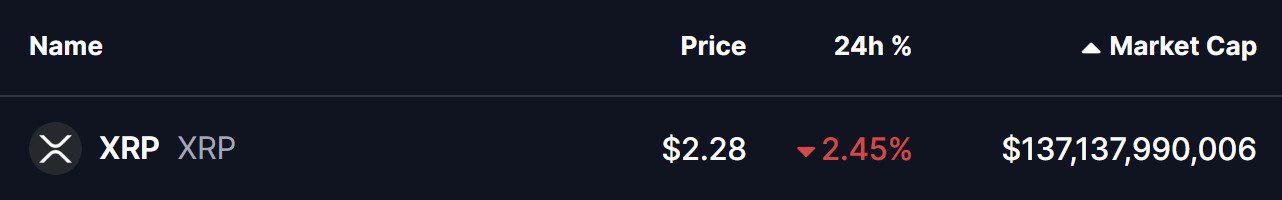 Source: Coinmarketcap
Potential Bullish Harmonic Pattern in Play
On the daily chart, XRP appears to be forming a Bearish Bat (Gartley-like) harmonic pattern — a well-known structure that often identifies potential reversal zones once its final leg (Point D) is completed.
The formation began at Point X near $3.1034, followed by a sharp decline to Point A, a corrective bounce to Point B, and another drop that recently touched Point C around $2.2285. Since then, XRP has shown signs of stabilization, currently hovering near $2.28 as buyers cautiously step back in.
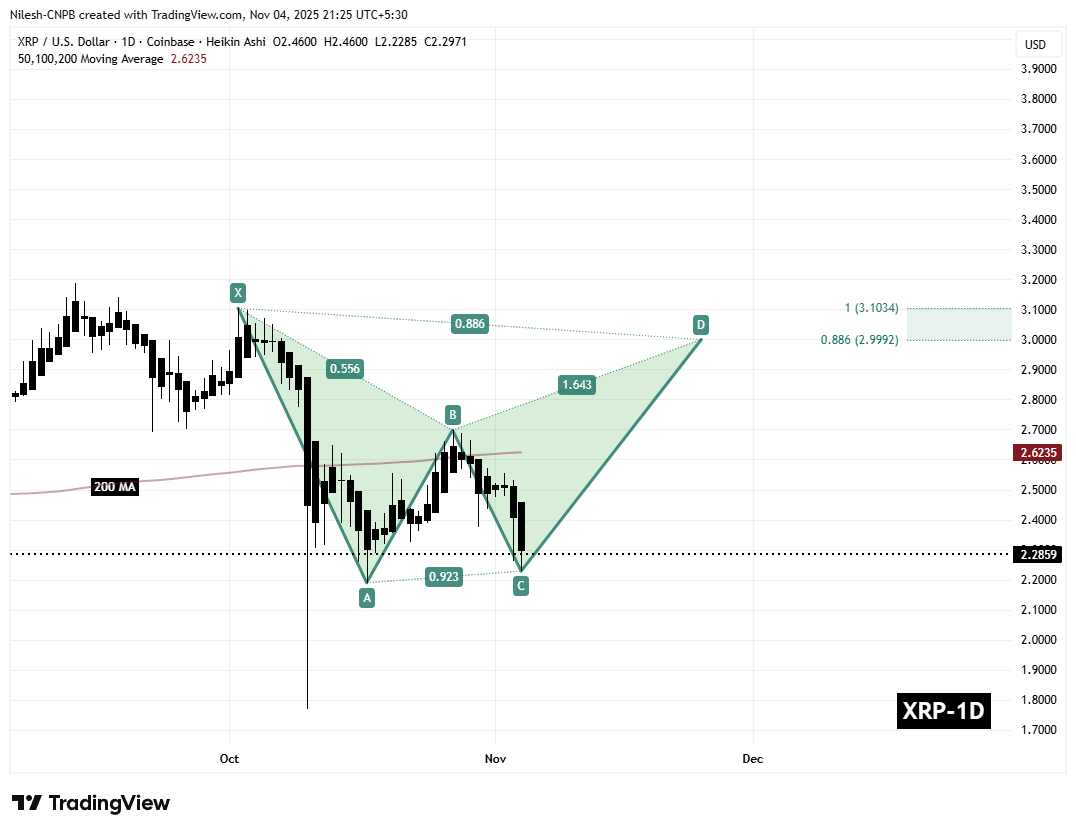 XRP Daily Chart/Coinsprobe (Source: Tradingview)
Adding confluence to the setup, XRP’s 200-day Moving Average (MA) — currently near $2.6235 — serves as a key technical resistance. A decisive breakout and close above this zone could strengthen the bullish case and signal a potential shift from consolidation to accumulation.
What’s Next for XRP?
For the harmonic structure to stay valid, XRP must hold above the $2.2285 (Point C) support while gradually climbing back toward its 200-day MA. If buyers maintain momentum, the pattern projects a move toward the Potential Reversal Zone (PRZ) between $2.99 and $3.10, corresponding to the 0.886–1.0 Fibonacci retracement levels.
This would imply an estimated 34% potential upside from current levels — signaling that XRP could be preparing for a technical bounce, especially if market sentiment improves.
However, traders should approach with caution. The pattern remains in formation, and a break below Point C could invalidate the setup, opening doors for deeper retracement before a stronger base forms