Solana (SOL) trades near $155 while its 1-day chart shows a multi-year triangle. A descending resistance line caps rallies from the 2025 peak, and a rising base supports pullbacks. Price now sits close to that lower blue trendline, which has guided higher lows since late 2023.
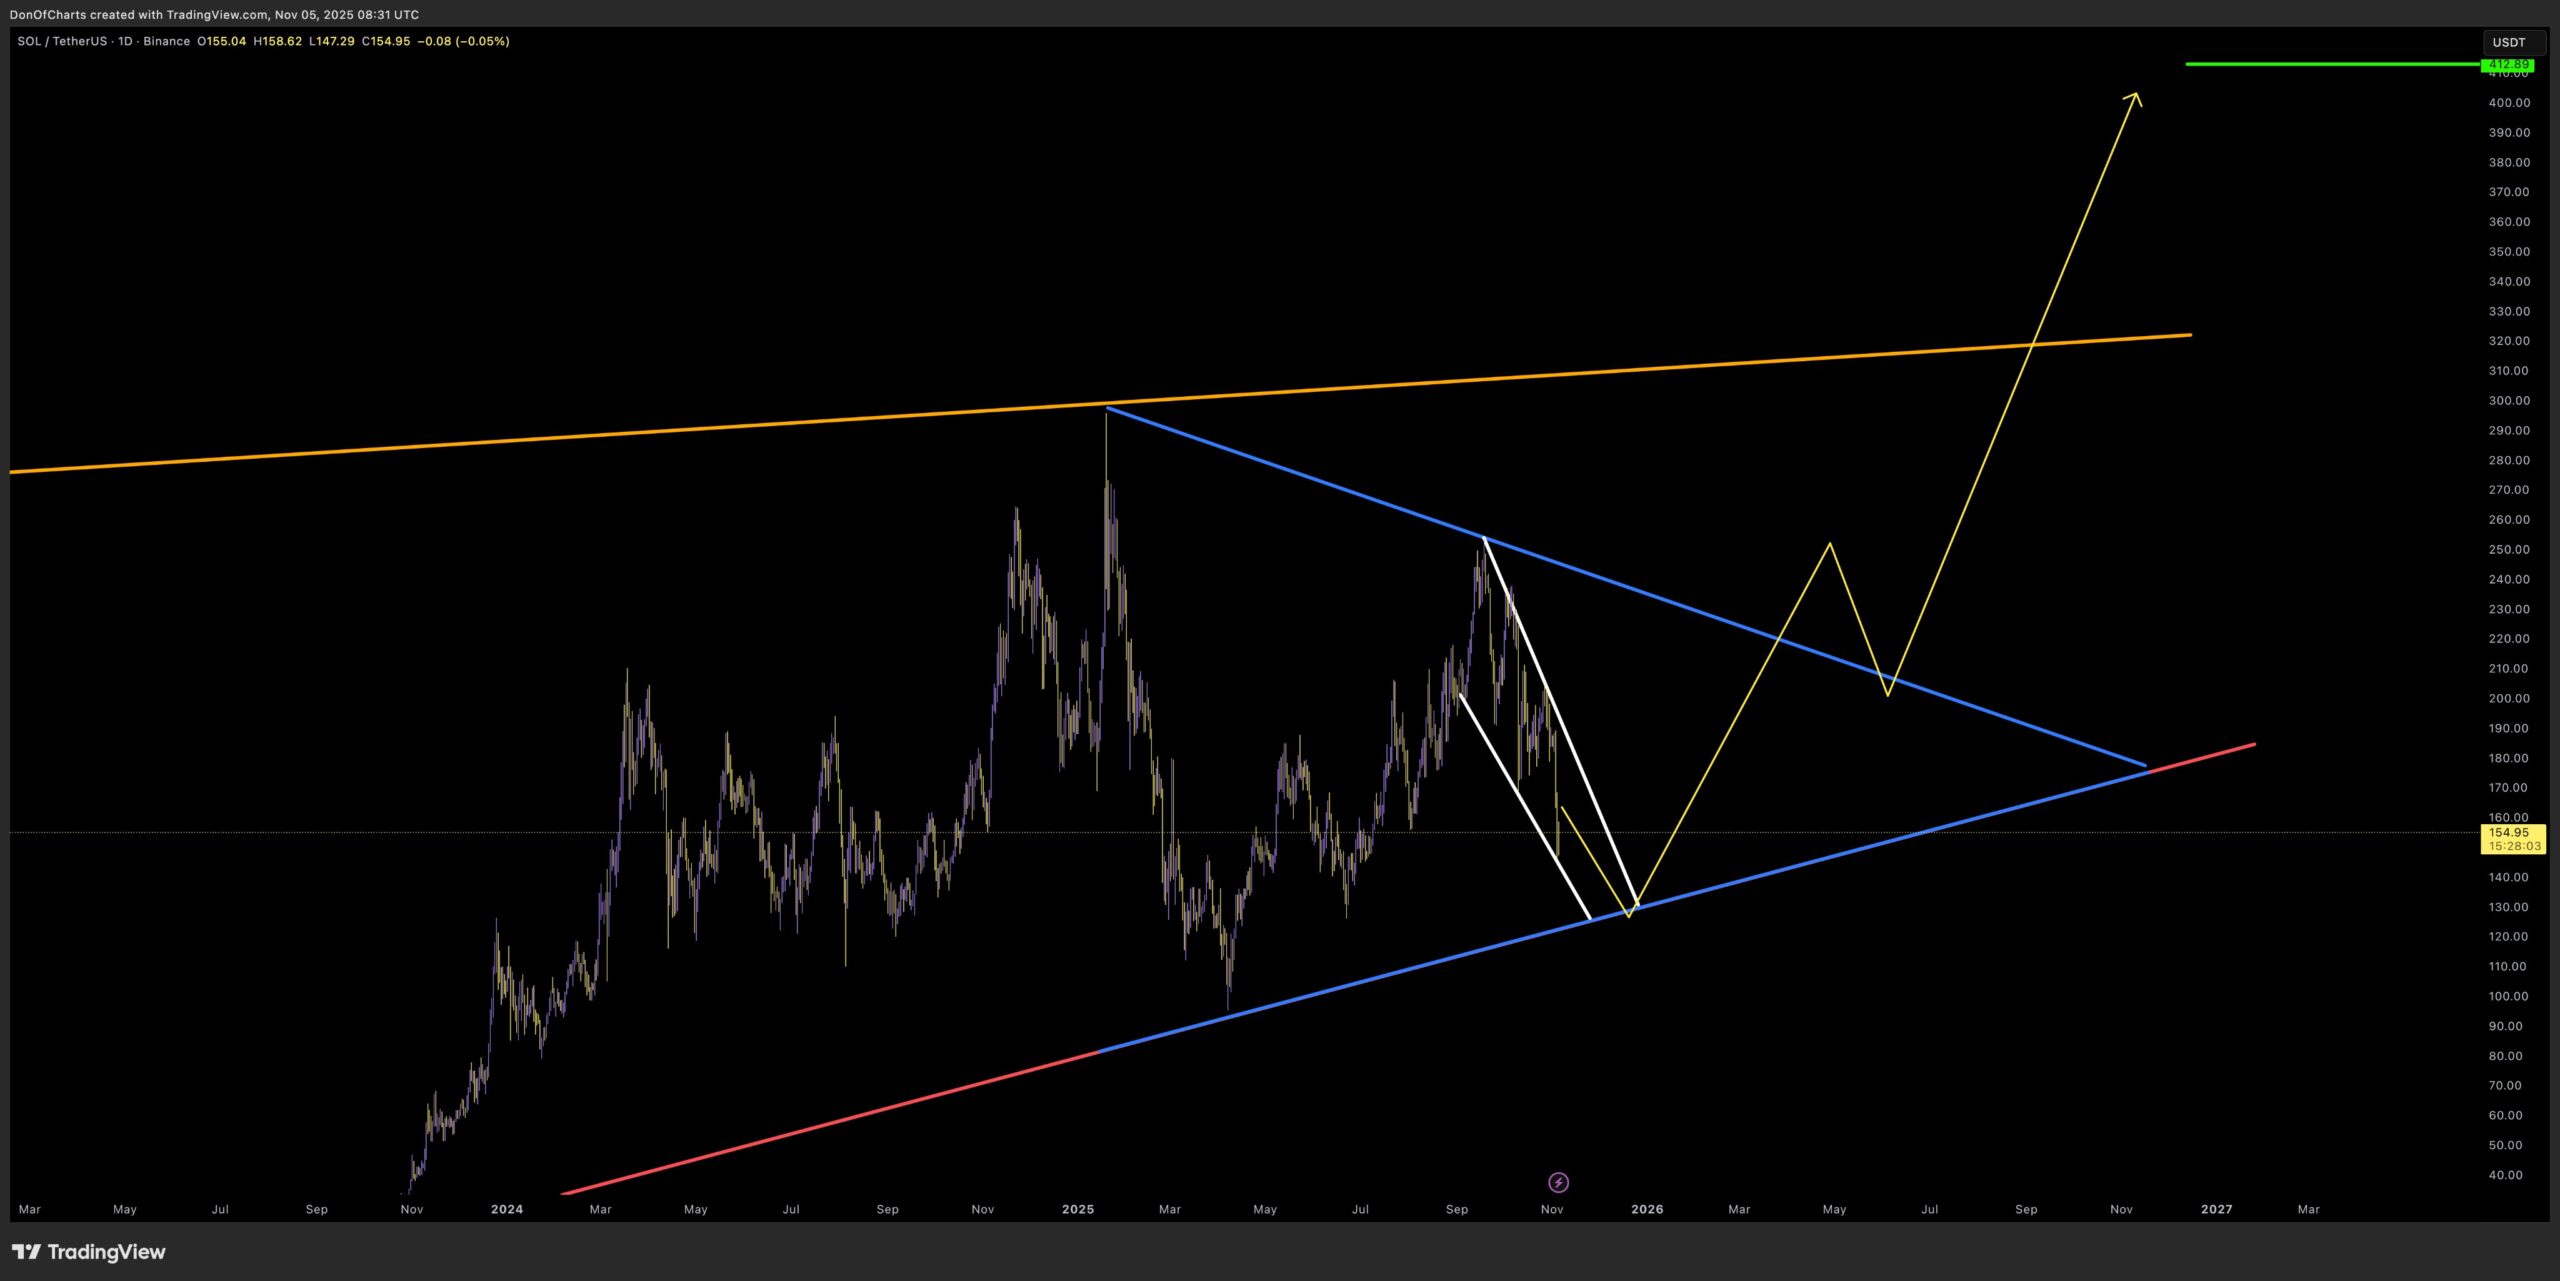 Solana Triangle Compression Path. Source: DonOfCharts on X
The chart sketches a short-term drop channel in white that funnels price toward the trendline. Consequently, the immediate focus sits on support in the mid-$150s to upper-$160s. A firm reaction there would keep the larger pattern intact and preserve the sequence of higher lows.
Then, the yellow path outlines a rebound phase. First, it points to a recovery toward roughly $230–$250 into mid-2026, followed by a pullback that retests the broken downtrend near ~$210. After that retest, the path shows continuation above the descending blue line, signaling a break from compression.
Finally, the scenario projects an extension toward the upper orange boundary and, later, a green marker around ~$420. The time axis places this maturation into late 2026, which aligns with how large consolidations often resolve after several touches on both sides.
However, the triangle remains the key reference. If price loses the rising base decisively, the mapped rebound path would not apply, and sellers would control the range. Until that break occurs, the structure frames SOL as compressing, testing support first, and then preparing for a directional move as the apex approaches.
Solana forms a falling wedge pattern, signaling potential rebound
Solana (SOL) trades around $155.80, forming a falling wedge pattern on the daily chart. A falling wedge is a bullish reversal setup that appears when price makes lower highs and lower lows within converging trendlines. It often signals that selling pressure is fading and a breakout to the upside could follow once resistance breaks.
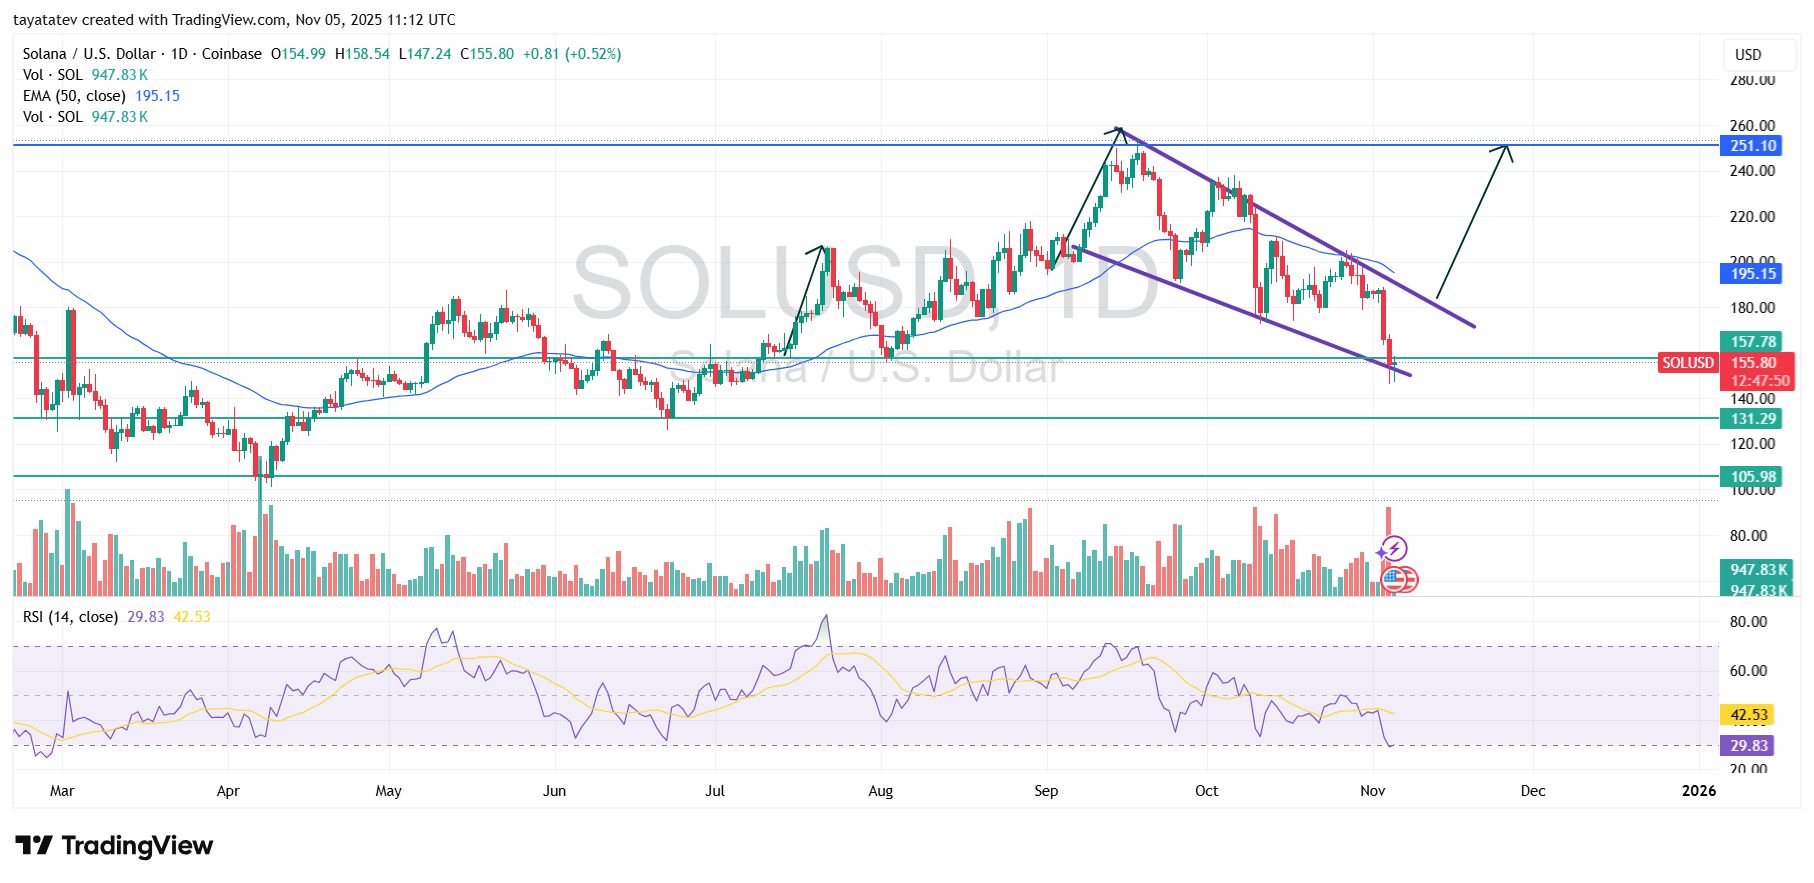 Solana Falling Wedge Setup. Source: tayatatev TradingView
At present, SOL’s price remains inside the wedge, testing support near $157, which aligns with a prior demand zone. The pattern suggests consolidation after months of lower highs since July. Trading volume has slightly declined during this period, a common sign of exhaustion before a reversal.
If the current support holds, SOL could begin building a rebound phase. However, if it slips further, the next support levels sit near $131 and then $105, marked by green horizontal lines. These zones show where buyers previously stepped in strongly. Each level may attract renewed interest if price revisits them.
Technical indicators add context. The Relative Strength Index (RSI) hovers around 30, suggesting oversold conditions, while the 50-day EMA near $195 acts as an overhead resistance target after any rebound. A confirmed breakout above the wedge’s upper line would signal strength returning.
If the falling wedge completes its pattern, SOL could rally by roughly 61% from its current price, pointing toward $251, the next major resistance highlighted on the chart. That level aligns with a prior swing high and represents the first strong target once momentum flips.
In short, Solana’s structure signals a bullish setup in progress. The wedge pattern, oversold RSI, and proximity to multi-month support together suggest that SOL is nearing a possible pivot area, provided it defends the current base.
Solana MACD slips below zero as bearish momentum eases
Solana’s daily MACD shows both the MACD and signal lines below the zero line, confirming a bearish phase. However, the histogram bars have started to shorten, so downside momentum now fades. After October’s sharp selloff, the MACD line hooked upward slightly, while the signal line still slopes down. This divergence often precedes a momentum inflection.
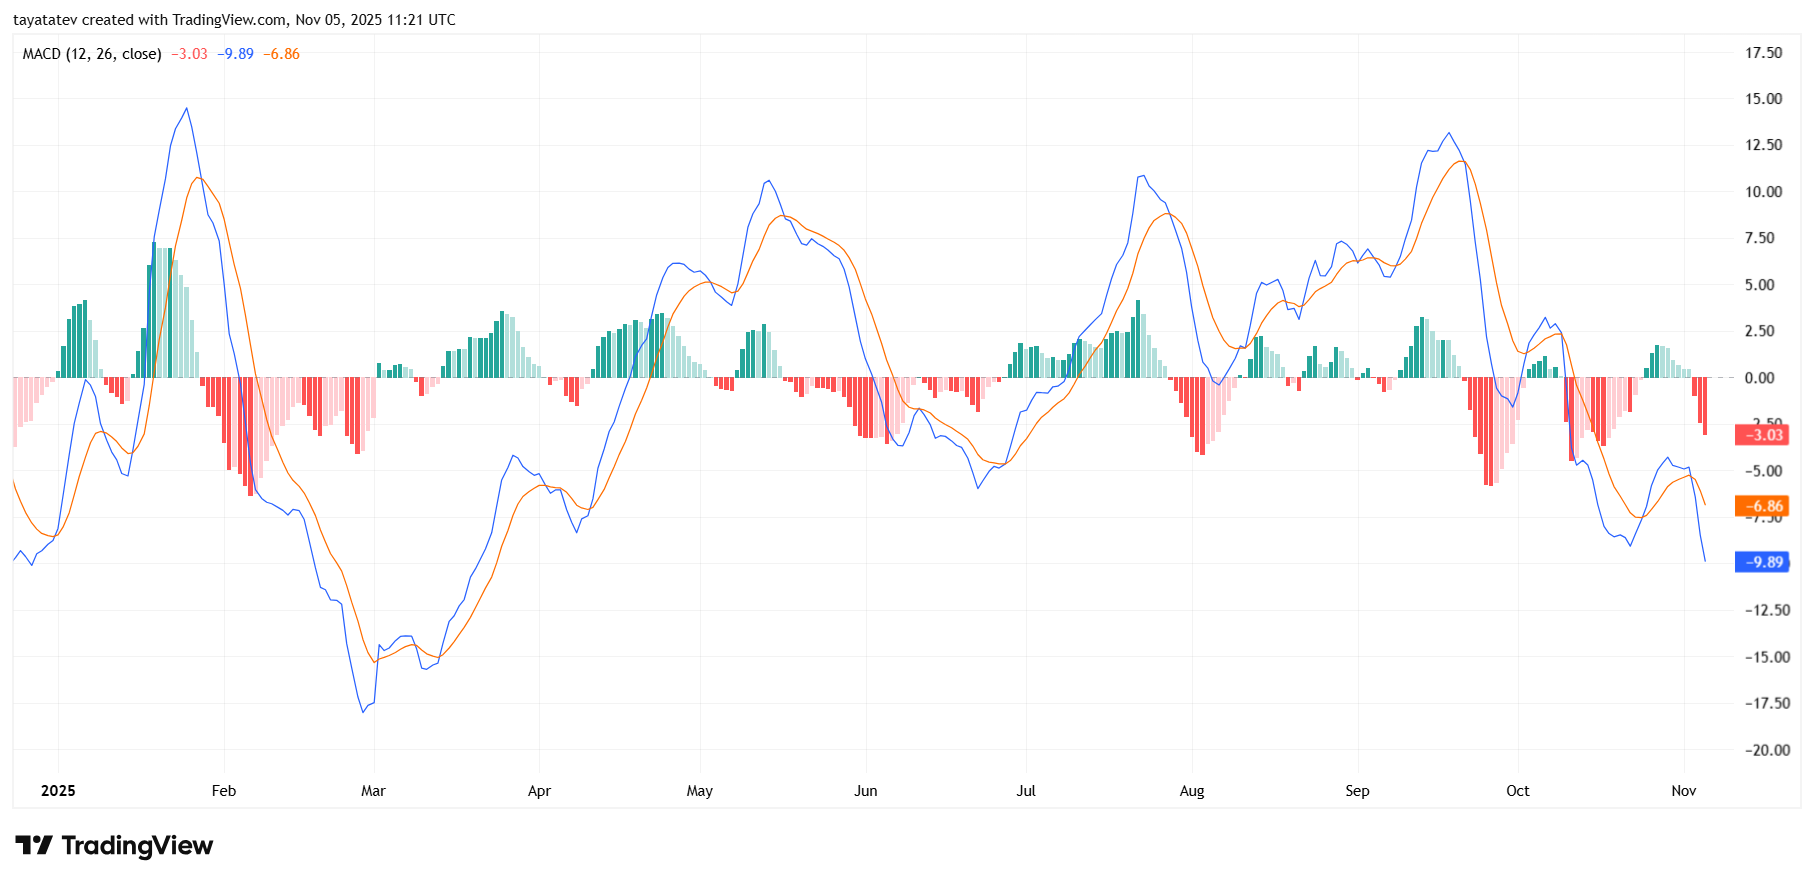 Solana Daily MACD Momentum. Source: tayatatev TradingView
Moreover, previous swings this year show that when the histogram contracts toward zero after deep red prints, price usually stabilizes before attempting a rebound. Yet, confirmation still requires the MACD line to cross above the signal line and then reclaim the zero line. Until that sequence appears, sellers retain the tactical edge, and rallies face resistance.
In sum, the MACD reads “bearish but weakening.” If the crossover triggers next, it would flag improving momentum; if the histogram expands lower again, it would signal another leg down.

Editor at Kriptoworld
LinkedIn | X (Twitter)
Tatevik Avetisyan is an editor at Kriptoworld who covers emerging crypto trends, blockchain innovation, and altcoin developments. She is passionate about breaking down complex stories for a global audience and making digital finance more accessible.
📅 Published: November 5, 2025 • 🕓 Last updated: November 5, 2025