Key takeaways:
Solana's rebound from its weekly support at $130 signals a potential price recovery to $250.
An increase in open interest and spot demand signals the return of buyers into the market.
Institutional demand for SOL rises with $390 million in cumulative ETF inflows, driven by investors’ excitement for future Solana ETF launches.
Solana ( SOL ) weekly chart suggests that SOL price may have formed a bottom near $130, a setup that could help SOL price recover toward $250 in the weeks ahead.
SOL’s market structure hints at a return to $250
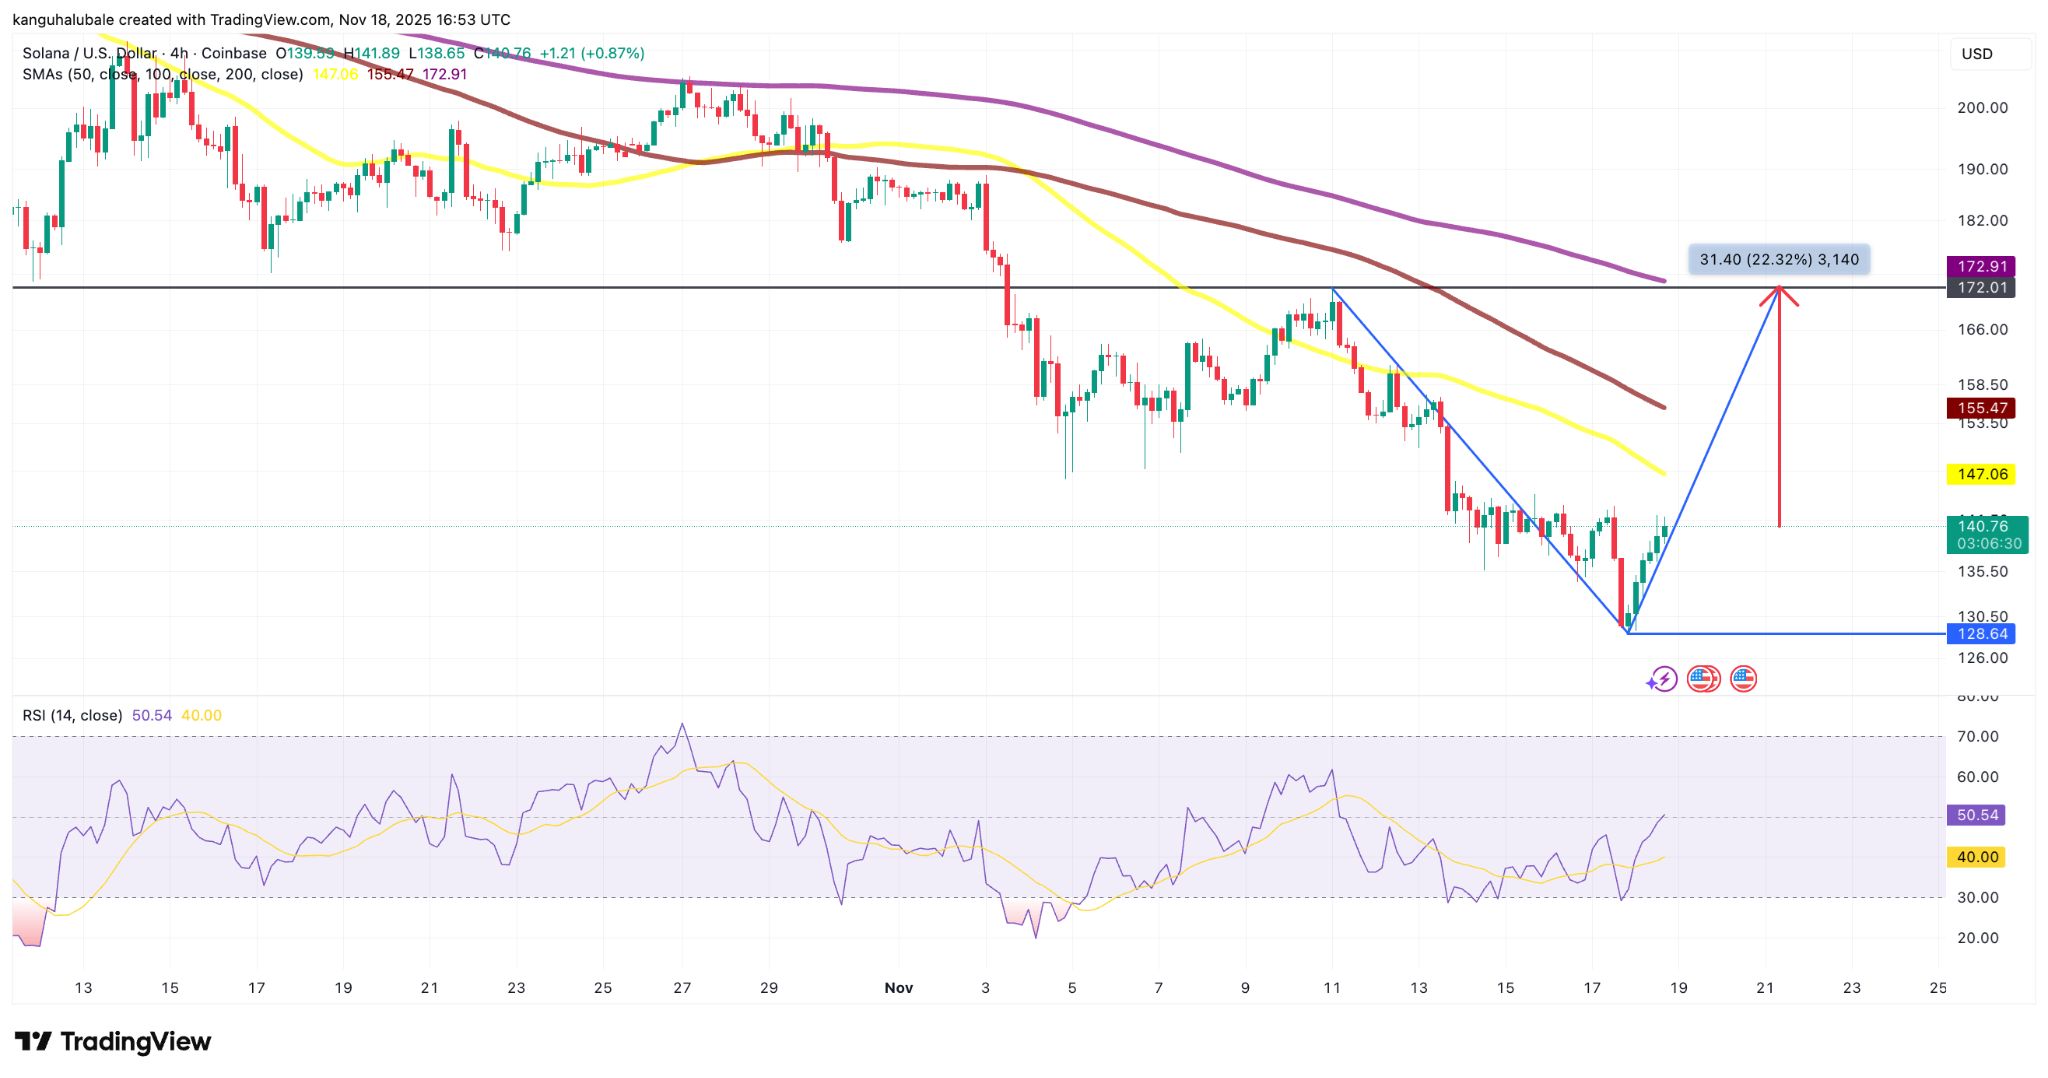
SOL’s price action since Nov. 11 has led to the appearance of a V-shaped recovery pattern on the four-hour chart. This follows a sharp drop that saw SOL price fall 25% from a high of $173.
Bulls bought the dip following this drop, resulting in a sharp recovery to the current levels. The relative strength index (RSI) has increased to 50 from 28 since Nov. 13, indicating increasing upward momentum.
Related: ‘Very wide gap’ between XRP and Solana investor interest: Exec
As the price attempts to complete the V-shaped pattern, it could rise further toward the pattern’s neckline, located around the $170 supply zone, representing a 22% climb from the current price.
 SOL/USD four-hour chart. Source: Cointelegraph/ TradingView
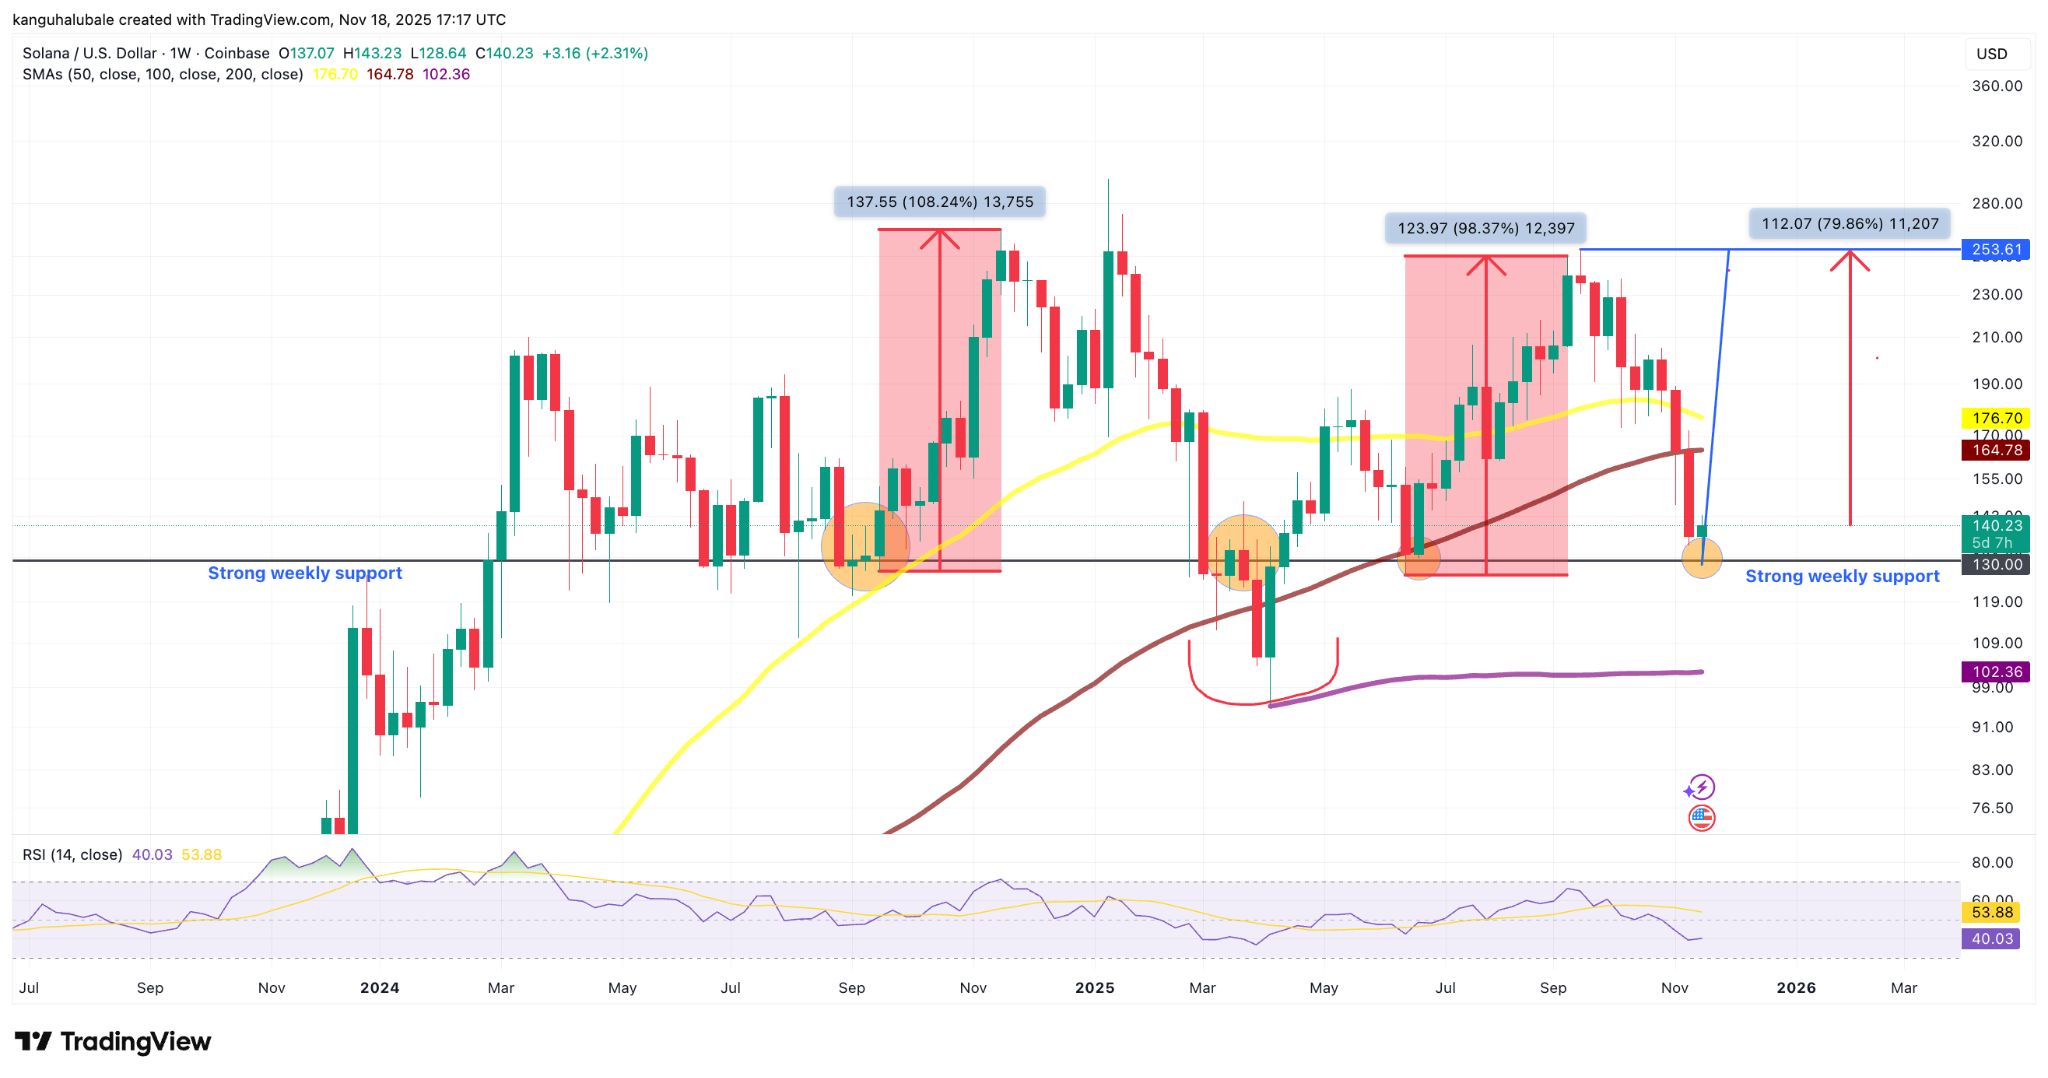
Zooming out, the weekly chart reveals strong support for the SOL/USD pair at $130, as shown below.
Previous rebounds from this level have triggered massive price rallies: a 108% increase to $265 from $127 between September 2024 and November 2024, and a 98% rally to $250 from $130 between June 2025 and September 2025.
If the same scenario plays out, SOL could extend today’s recovery to $250, representing an 80% increase from the current levels.
 SOL/USD weekly chart. Source: Cointelegraph/ TradingView
It is important to note that the RSI recently reached oversold conditions in lower time frames, levels that have historically preceded significant price reversals.
As Cointelegraph reported , SOL price may rise toward the $180-$200 range if the 20-day EMA at $160 is reclaimed at support.
Spot and futures buyers are back
CoinGlass data shows Solana’s futures open interest (OI) has increased by 5% over the last 24 hours to $7.3 billion. Similarly, perpetual funding rates (eight-hour) turned positive to 0.0059% from -0.0001% in tandem with the jump in OI.
Increasing OI and rising funding rates signal the return of demand in SOL’s futures market, setting the stage for a sharp reversal (short squeeze) if longs are overcrowded and a catalyst emerges.
Meanwhile, net taker volume has flipped positive, indicating that more buyers are stepping in at lower levels. Spot CVD is rising, highlighting that the recovery is both spot-driven and futures-driven, often taken as a healthy setup.
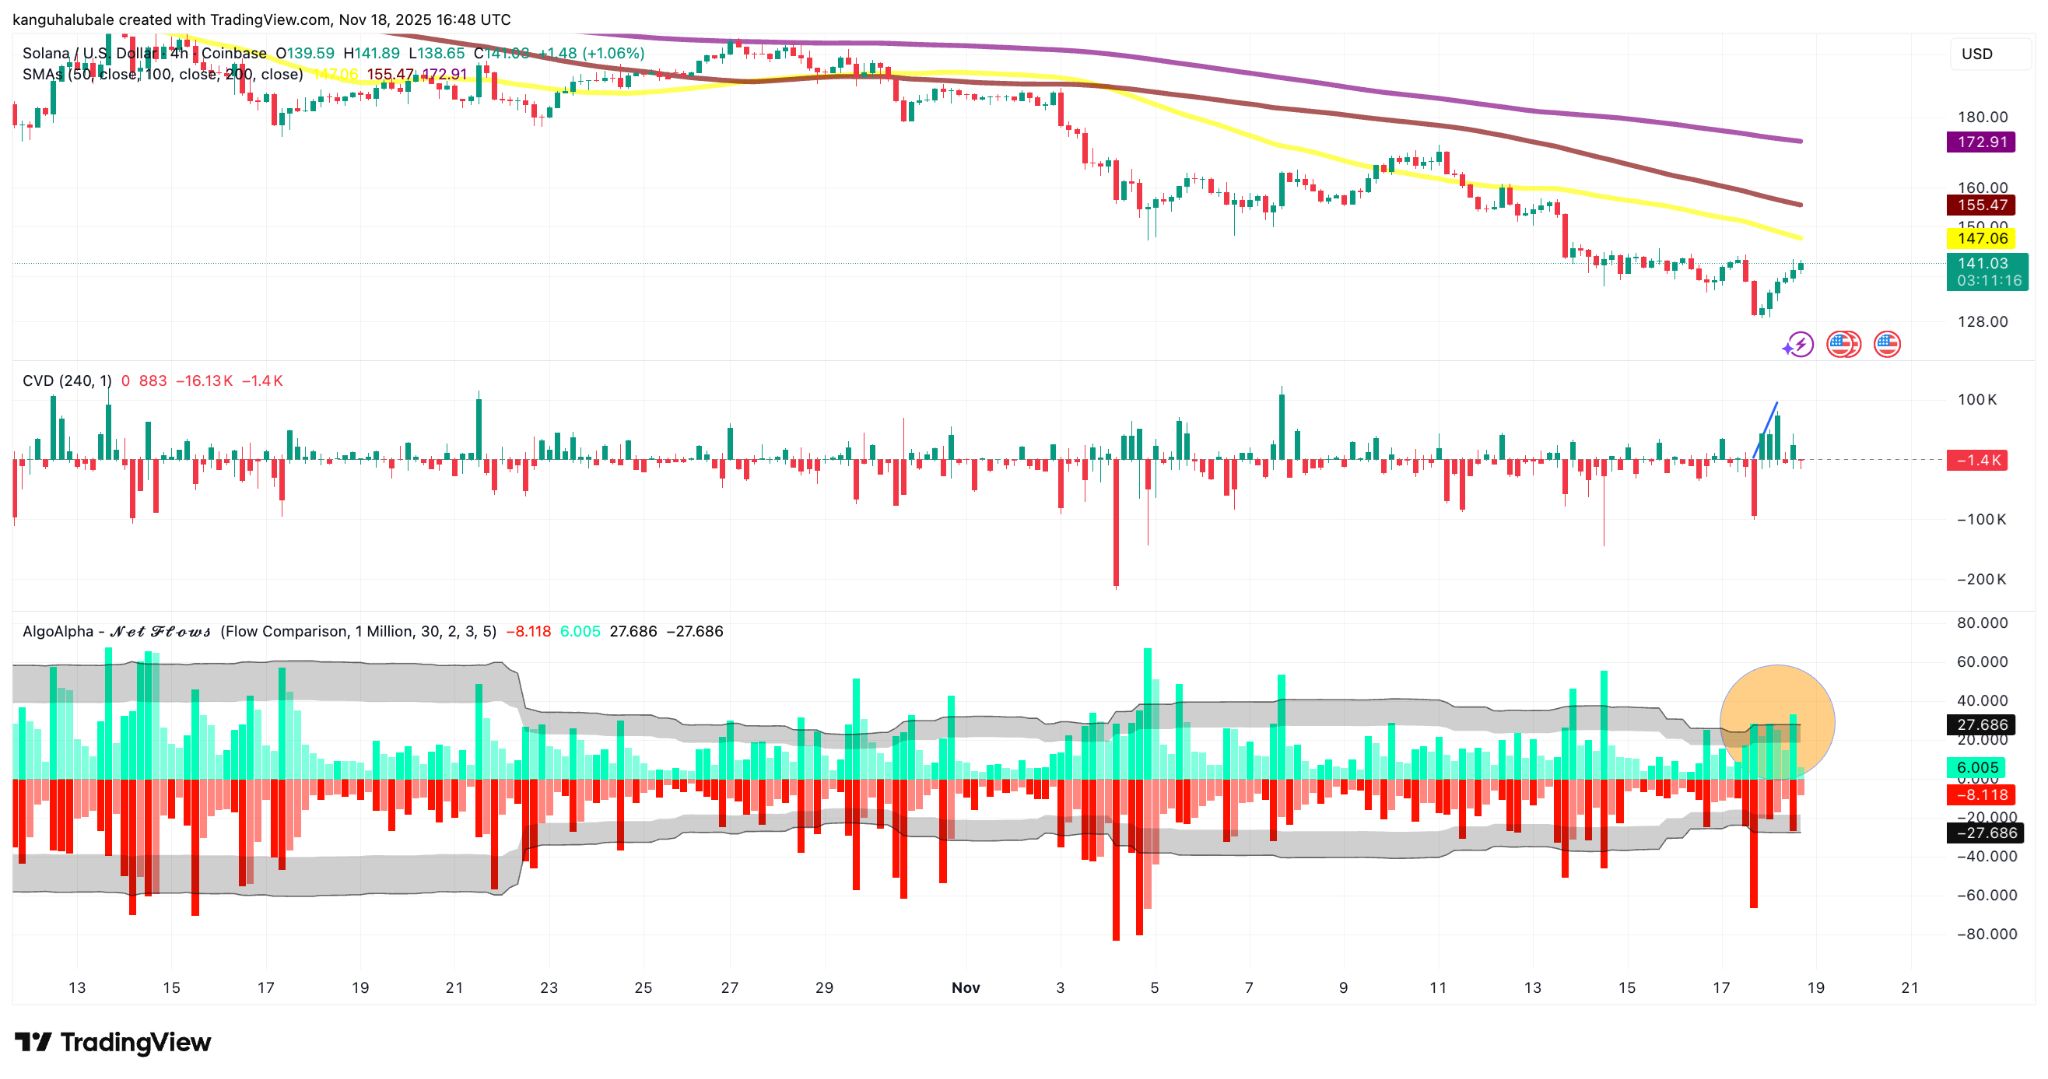 SOL price, Net taker volume and aggregated CVD spot and futures. Source: Cointelegraph/ TradingView
Investors increase exposure to Solana ETFs
Spot Solana exchange-traded funds (ETFs) continued to attract investor interest , recording their 15th straight day of inflows, underscoring institutional demand for the network’s native asset.
US-based SOL ETFs added $8.26 million on Monday, bringing cumulative inflows to $390 million and total net assets to over $513 million, per SoSoValue data.
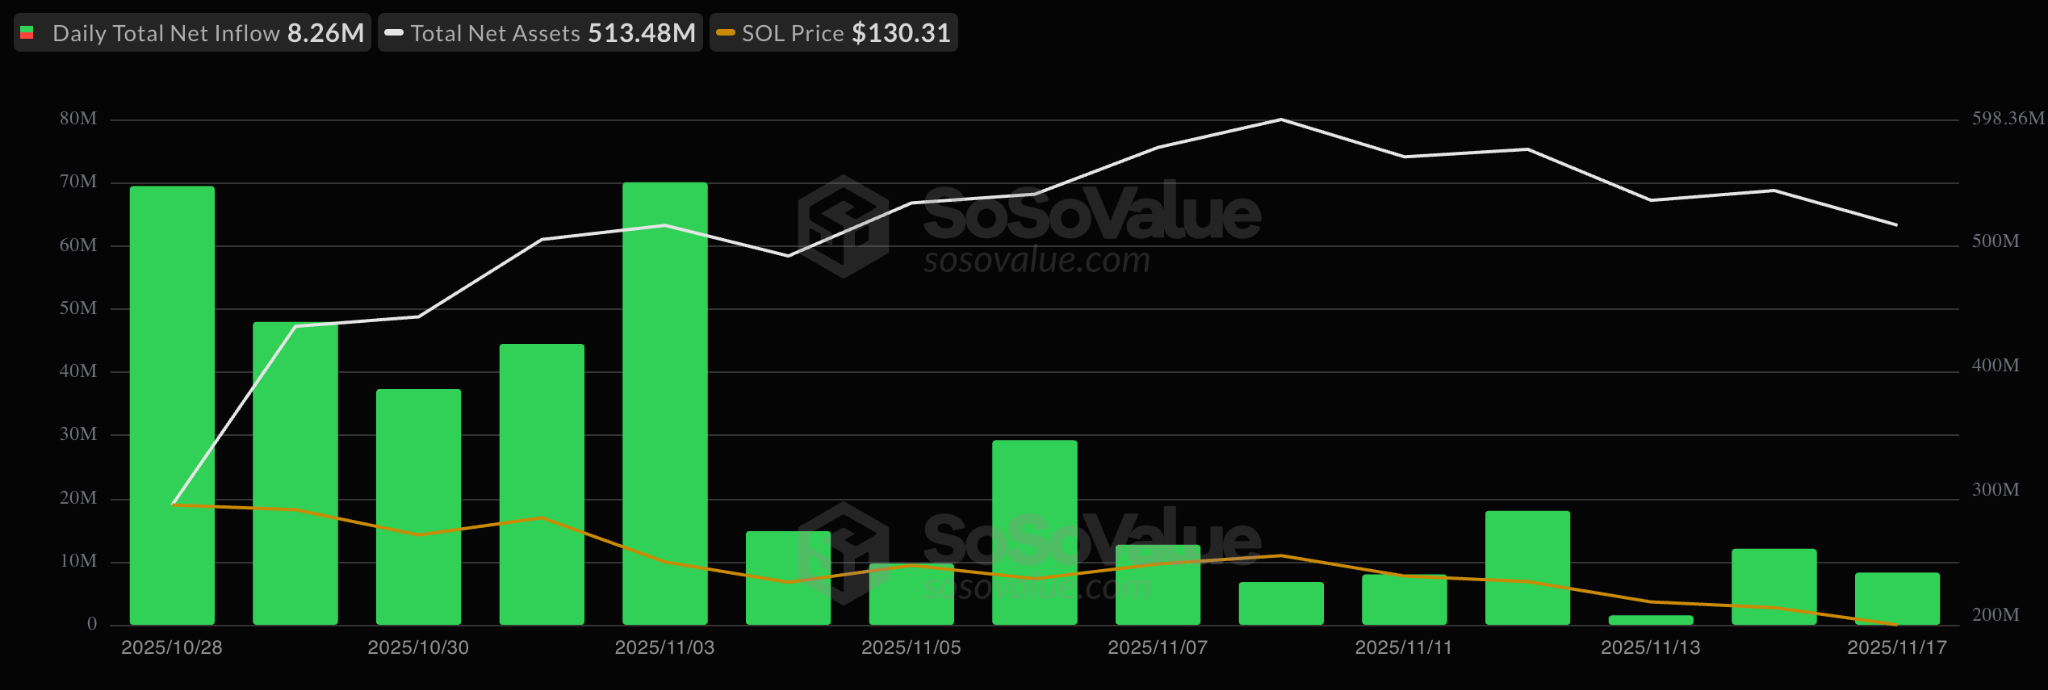 Spot Solana ETF flows data. Source: SoSoValue
VanEck’s Solana ETF launched on Monday , and many more ETFs are expected to go live over the next week, adding to SOL’s tailwinds.
Additional data from Nansen shows strengthening network metrics, including an 18% increase in daily active addresses and a 9.1% rise in daily transactions over the last 30 days.
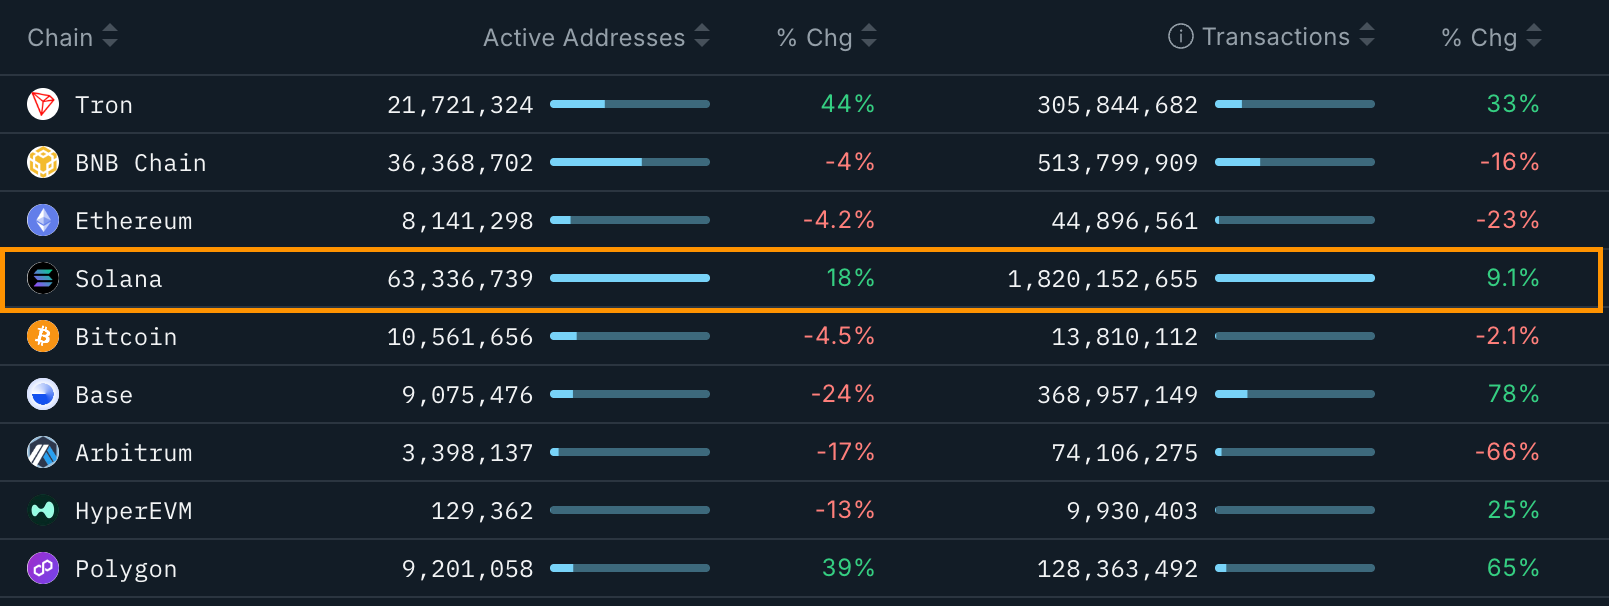 30-day performance of major blockchains. Source: Nansen
As Cointelegraph reported , Solana’s strong onchain metrics and DApps revenue dominance hint at long-term strength, backing SOL’s upside.