
Glassnode: BTC Dips to $89K, Options Market Shows Continued Hedging Sentiment

In the short term, the $95,000 to $97,000 range may serve as a local resistance. If the price is able to climb back above this range, it would indicate that the market is gradually restoring balance.
Original Title: Below the Band
Original Authors: Chris Beamish, CryptoVizArt, Antoine Colpaert, Glassnode
Original Translation: Golden Finance
Key Points of the Article:
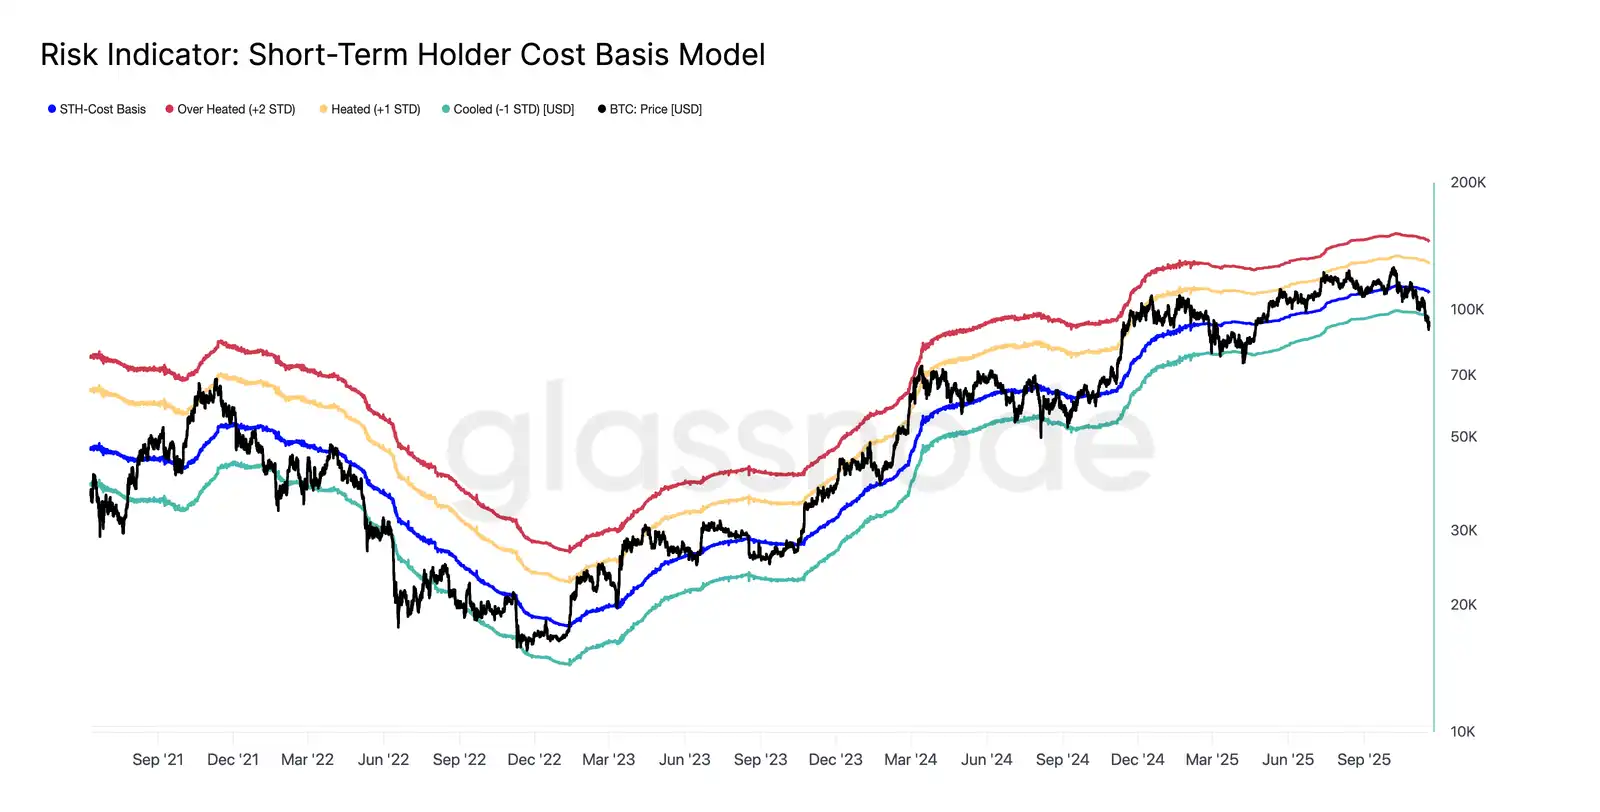
• Bitcoin has dropped below the STH (Short-Term Holder) cost basis and the -1 STD (Standard Deviation) range, putting pressure on recent buyers; the $95,000 to $97,000 range has now become a key resistance level, and reclaiming this area would signify an early step in market structure recovery.
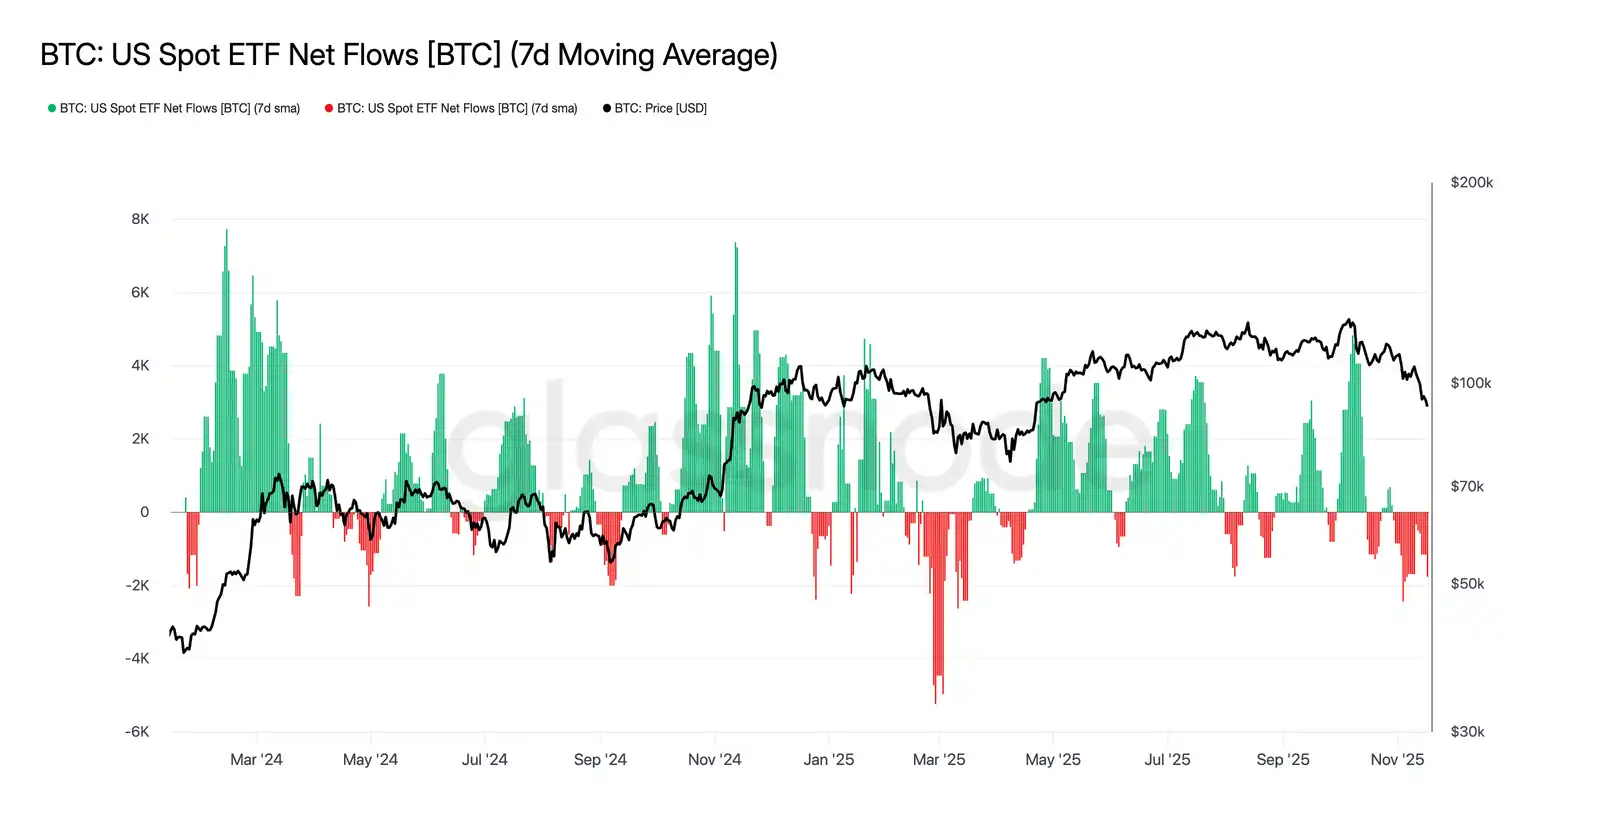
• Spot demand remains weak, with significant negative fund flows in the US spot ETF, and TradFi asset allocators have not added any buy-side pressure.
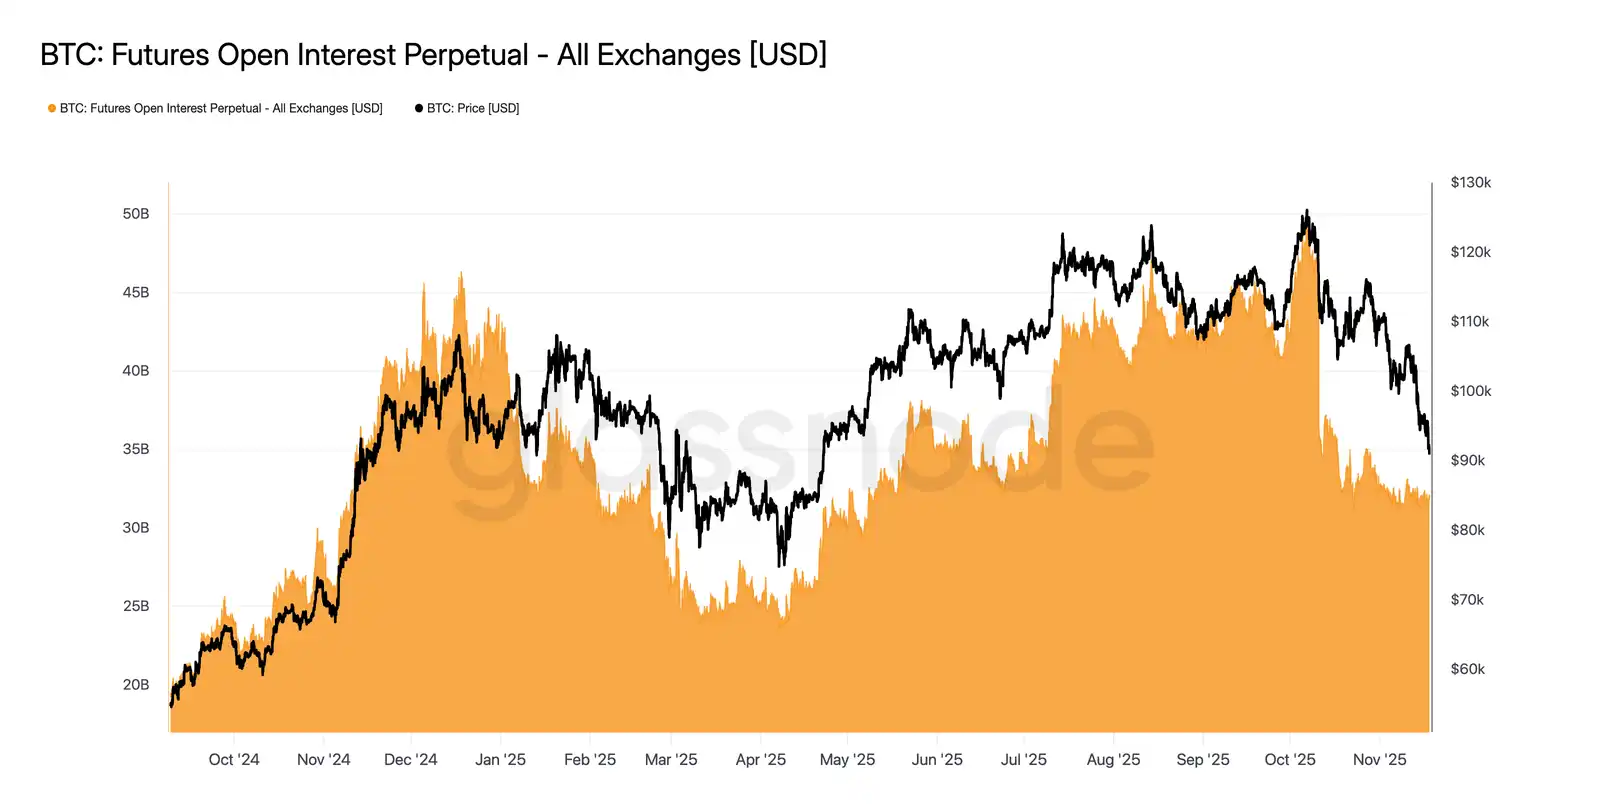
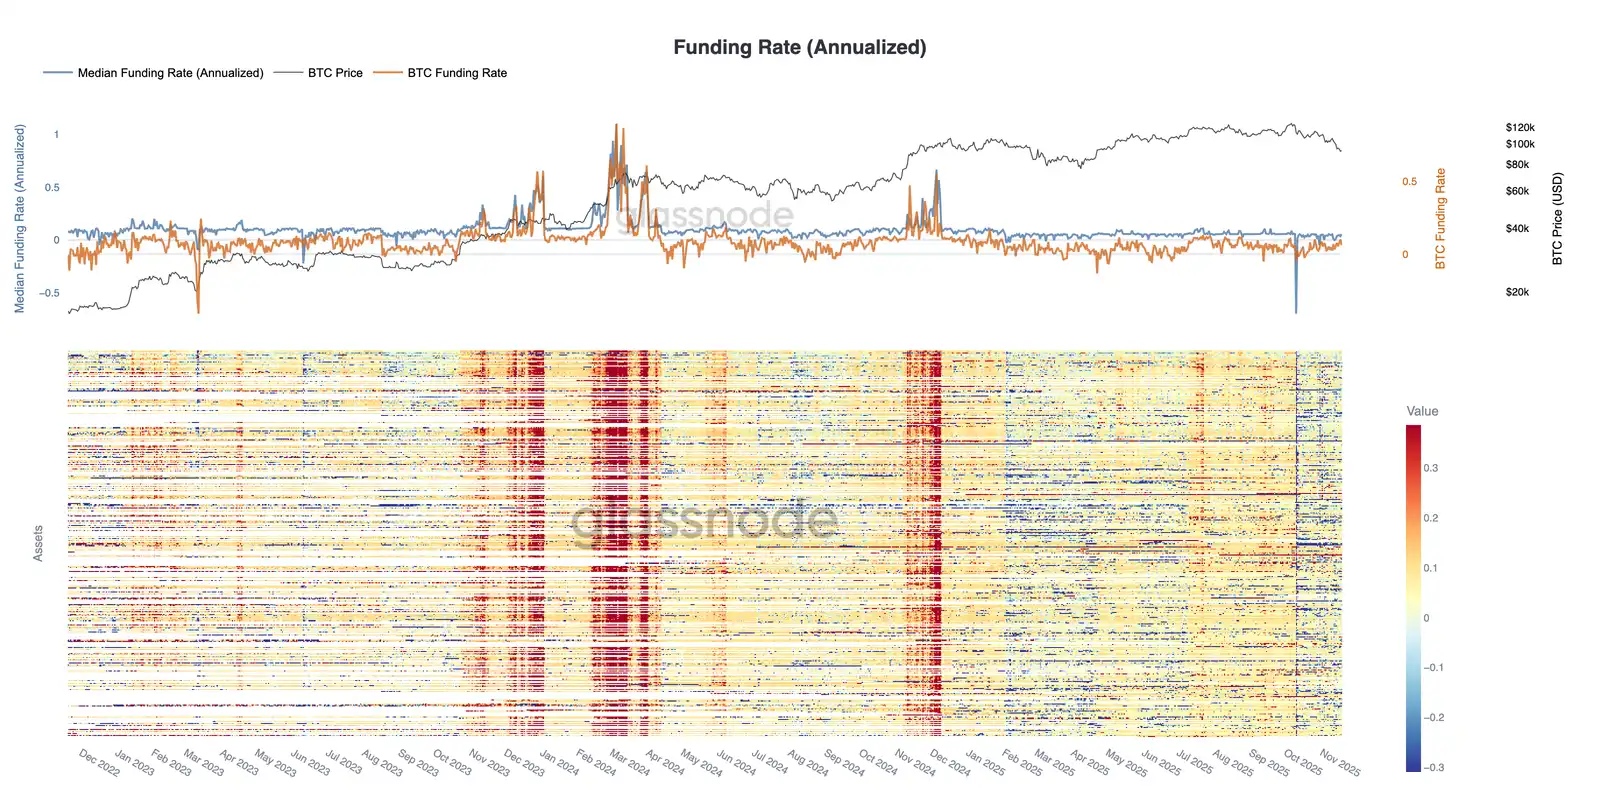
• Speculative leverage continues to decline, reflected in decreasing open interest in futures contracts for the top 500 assets and funding rates dropping to cycle lows.
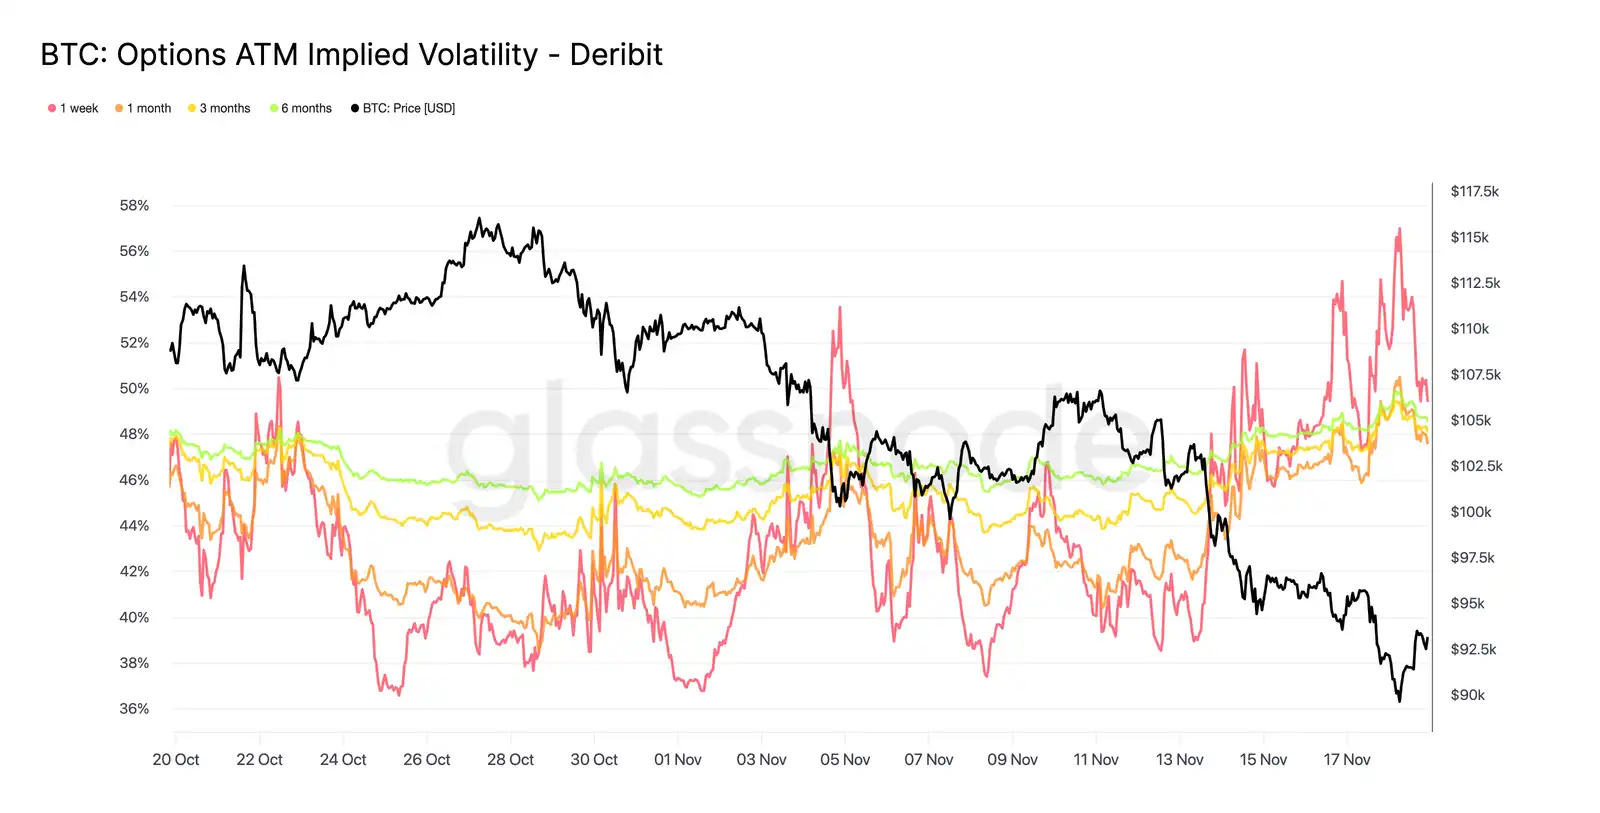
• The options market has significantly repriced risk, with implied volatility rising across all tenors, skew remaining low as traders pay a premium for downside risk protection.
• Downside put option-dominated flows and demand around key strike prices (e.g., 90K) have reinforced defensive positioning strategies, with traders actively hedging more than adding to upside risk exposure.
• DVOL has recovered to monthly highs, linking volatility, skew, and flow metrics for a broad repricing of risk and signaling the expectation of near-term volatility increase.
Bitcoin has broken below its previous consolidation range, dropping below $97,000 to briefly touch $89,000, establishing a new local low and flipping its year-to-date gains negative. This deeper decline extends the mild bear trend we highlighted last week, prompting questions about the potential reemergence of structural support. In this issue, we will use on-chain pricing models and short-term holder loss realization to assess the market's response to this decline. Following that, we will analyze options, ETF fund flows, and futures positions to evaluate how speculators are adjusting their sentiment in this new round of soft market conditions.
On-Chain Insights
Breaking Below the Lower Band
Breaking below $97,000, the lower bound of last week's "range-bound area," signaled the risk of a deeper pullback. Subsequently, the price plummeted to $89,000, forming a new local low, below the -1 standard deviation level relative to the short-term holder cost basis (currently near $109,500).
This decline confirms that nearly all investor groups have experienced losses recently, a structure that historically triggers panic selling and weakens market momentum, requiring time to recover. In the short term, the $95,000 to $97,000 range may pose local resistance, and regaining this range would indicate a gradual market balance restoration.
Panic Selling Peaks
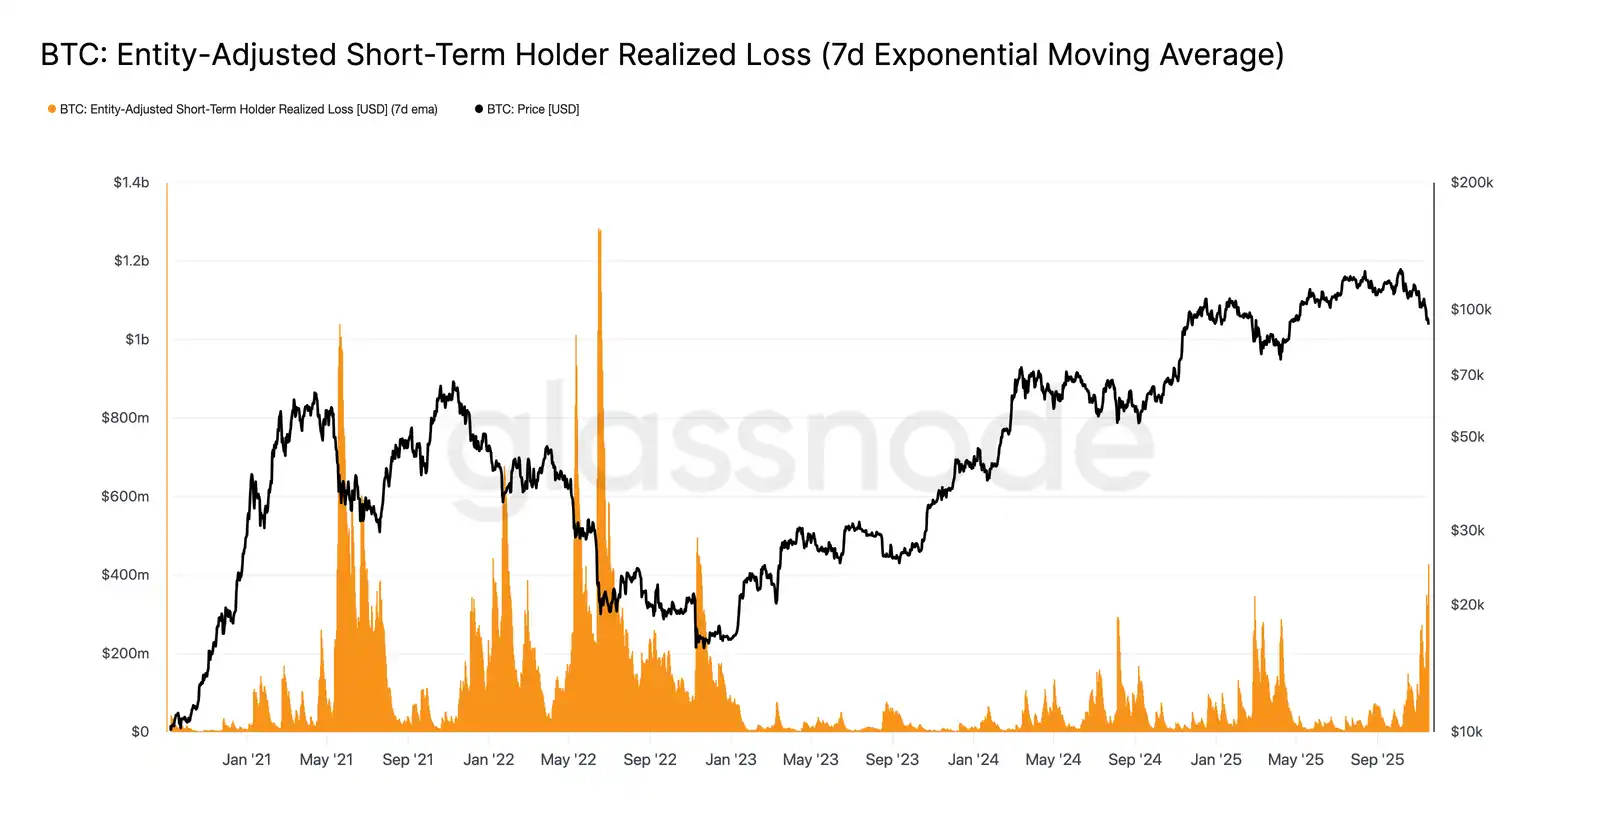
From an investor behavior standpoint, this recent crash marks the third time since early 2024 that the price has dropped below the short-term holder cost basis model. However, the panic level of top buyers this time is significantly higher. The 7-day moving average of Short-Term Holder (STH) realized losses has surged to a daily $5.23 billion, reaching the highest level since the FTX flash crash.
Such a high realized loss highlights a heavier top structure formed between $106,000 and $118,000, with a density far exceeding previous cycle peaks. This indicates that either stronger demand is needed to absorb BTC sell-offs, or the market needs to go through a longer, deeper accumulation phase to restore balance.
Testing Active Demand
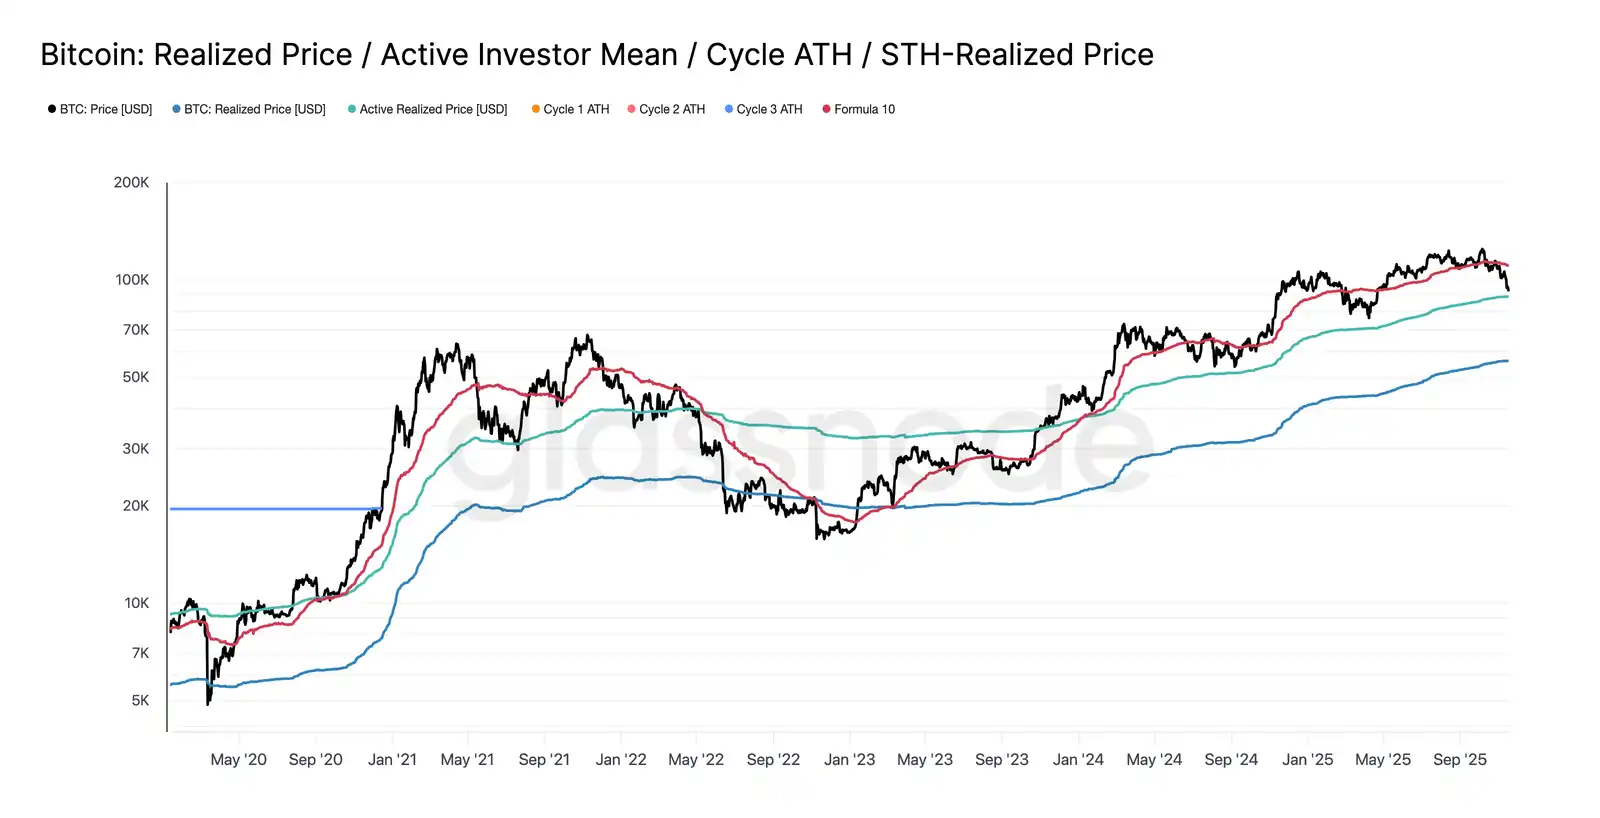
Reexamining the valuation model, the market has now entered uncharted territory, with speculative interest significantly increasing in this mild bear market phase. The first major defense area is the Active Investors' Realized Price, currently around $88,600. The trading price of Bitcoin near this level is equivalent to the cost basis of non-dormant holders who have actively traded in recent months, making it a potential mid-term trading range.
However, if the price decisively breaks below this model, it signifies the first time in this cycle that the price has dropped below active investors' cost basis, clearly indicating a bearish trend dominating the market.
Another Form of Retreat
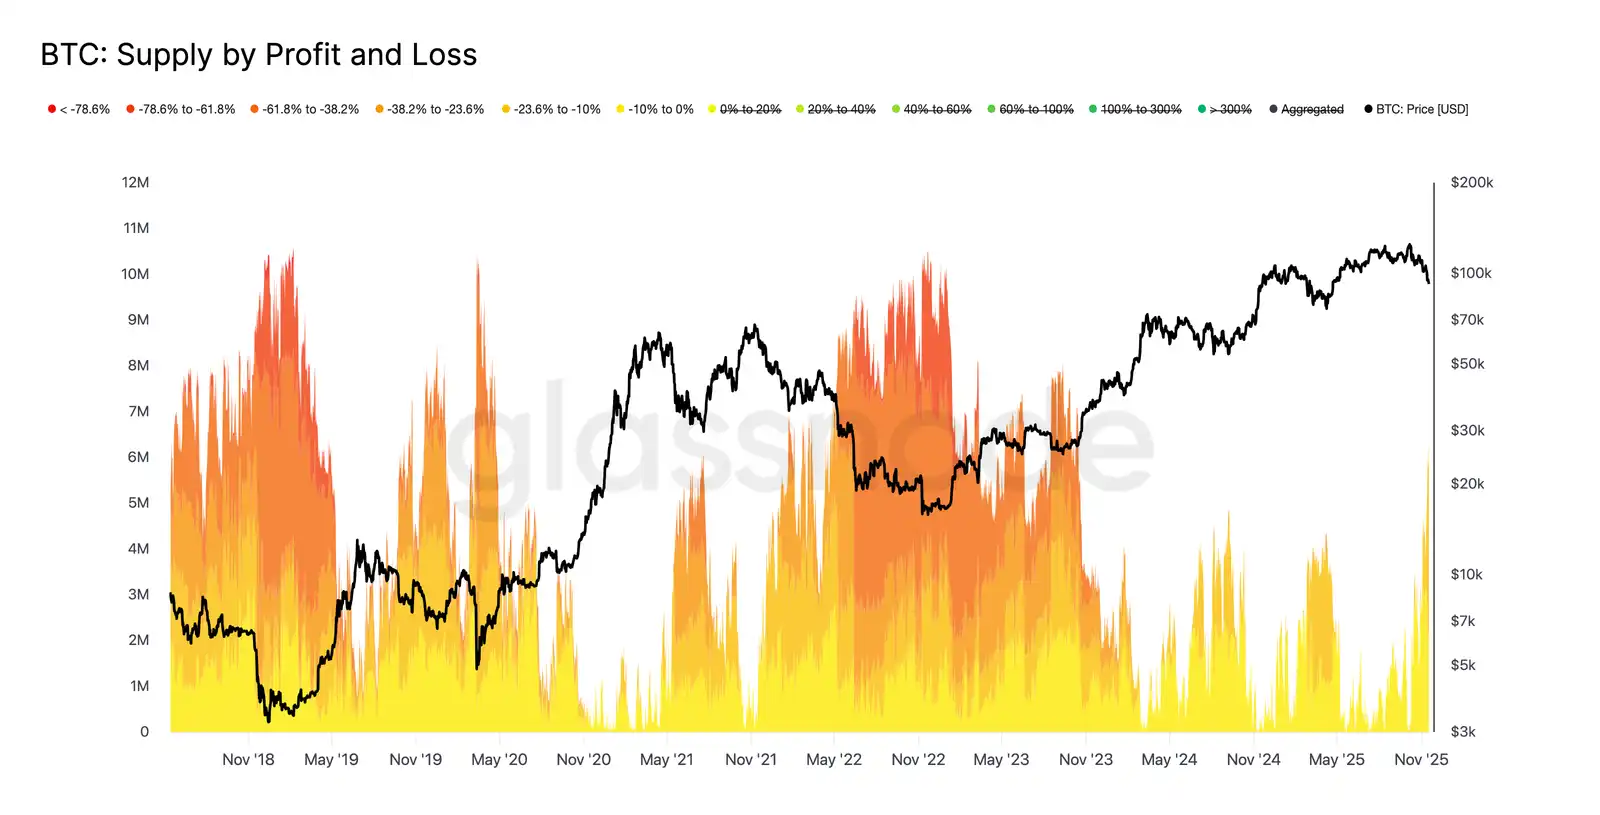
While the Bitcoin price has fallen below the key lower limit of the short-term holder cost basis model, the scale and extent of losses suffered by investors are far less severe than during the extreme conditions of the 2022-2023 bear market. The chart below tracks all currently underwater cryptocurrencies and groups them by the depth of their unrealized drawdown. Currently, about 6.3 million Bitcoins are in a losing position, with most of the losses ranging from -10% to -23.6%.
This distribution more closely resembles the brief range-bound market of the first quarter of 2022 rather than a stage of deep capitulation.
Hence, the price range between the Active Investors' Realized Price ($88,600) and the true market mean ($82,000) may serve as a delineation between a mild bear market phase and a structure resembling the full-fledged bear market of 2022-2023.
Off-chain Insight
Insufficient ETF Demand
The continuous outflow of funds from U.S. spot ETFs has consistently reflected a significant lack of demand, with the 7-day moving average remaining negative in recent weeks. The persistent outflow indicates that traditional financial asset allocators are unwilling to increase their holdings in the current bearish market, in stark contrast to the strong inflow pattern that supported the previous market rally. The sustained weakness suggests that non-discretionary investment demand has cooled significantly, highlighting the absence of incremental buyers, one of the market's largest marginal buyer groups, further reinforcing the overall constrained demand situation. The lack of continuous inflow into ETFs indicates that a key pillar of demand has yet to recover, leading to a critical demand source missing from this cycle's market.
No Risk Sign
This week, the open interest of futures contracts continued to decline in sync with prices, indicating a sustained reduction in speculative activity. Traders have not taken advantage of the dip to buy but have systematically closed positions, leading to a significantly lower derivatives market position than the previous decline level. The absence of leverage expansion highlights market participants' cautious attitude, aligning with the broader trend of reduced demand from risk-seeking groups.
The ongoing contraction of futures positions highlights that the market remains unwilling to deploy funds, further exacerbating the lack of confidence behind the current price trend.
Financing Rate at a Cyclical Low
As the open interest of futures contracts continues to decrease, the derivatives market is signaling a clear reduction in speculative positions. Traders are closing positions rather than buying the dip, leading to a leverage ratio in open interest significantly lower than the previous decline level.
This dynamic is also reflected in the financing market, where the top 500 asset rates have notably turned towards neutral or negative territory. The previously observed premium rally has now turned negative, highlighting a widespread cooling of leveraged long demand and a market shift towards more defensive strategies.
The decrease in open interest and negative financing collectively confirm that speculative leverage is systematically being withdrawn from the market, thereby strengthening risk-off sentiment.
Sharp Rise in Implied Volatility
The options market is typically the first market to reprice risk, and after a brief dip in the Bitcoin price below $90,000, the options market promptly completed a risk reassessment. Implied volatility across all maturities has sharply risen, with the near-term options showing the most intense reaction. The chart shows a significant increase in short-term options volatility, with the entire options curve undergoing extensive repricing.
This growth reflects two driving factors. First, the demand for downside protection has increased as traders prepare for a potential larger pullback. Second, the response from the short-gamma trading desks. Many traders have had to buy back short options and roll positions up, mechanically driving up the near-term implied volatility.
The implied volatility is currently close to the levels seen during the October 11 liquidation event, indicating that traders have rapidly reassessed recent risks.
This Dislocation Confirms Concerns
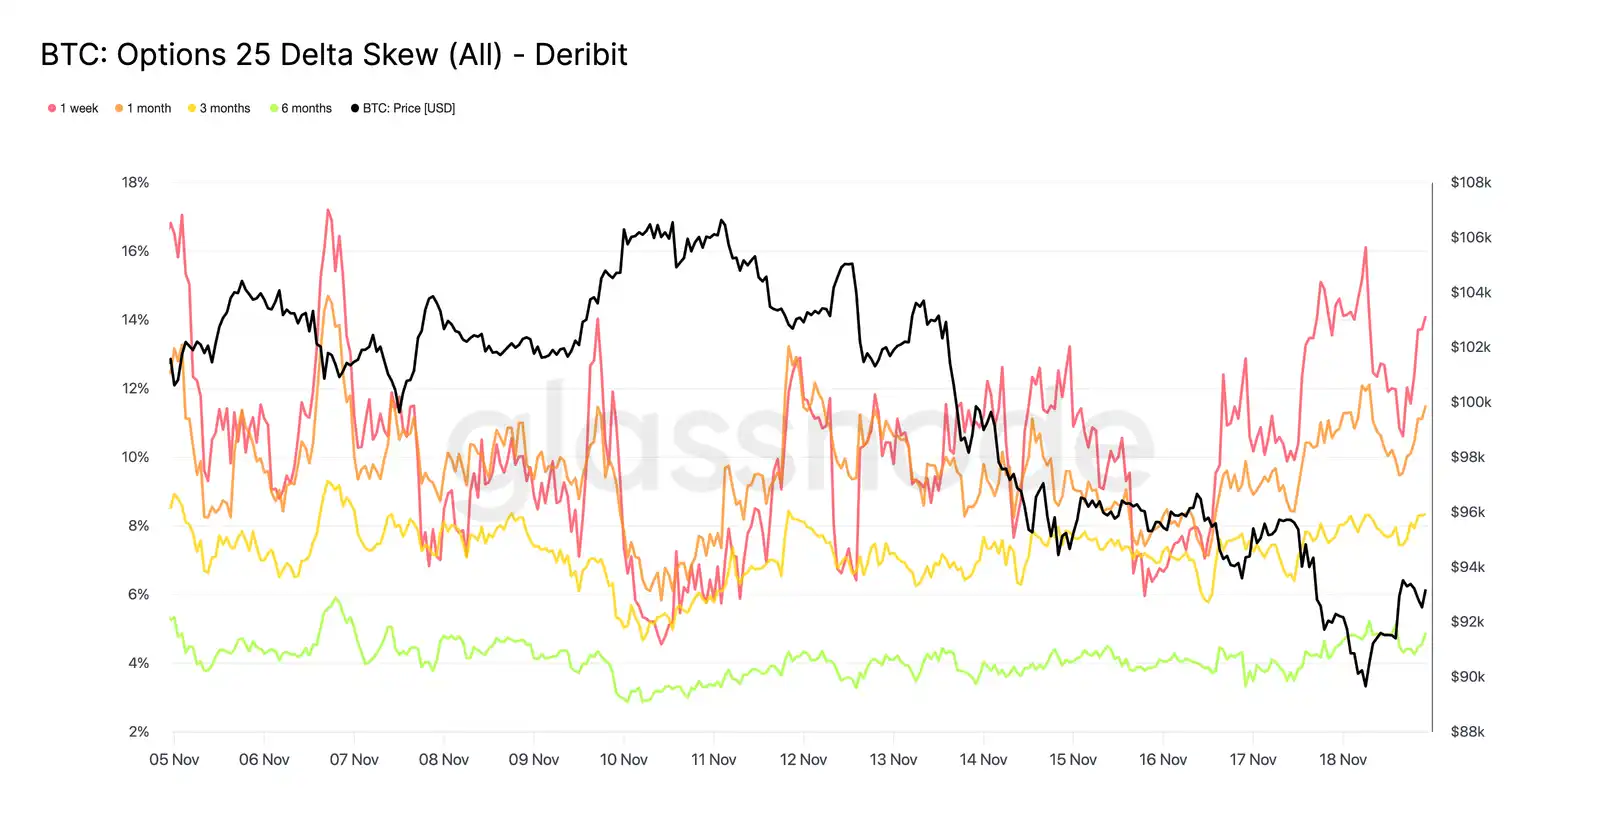
From implied volatility to skew, the options market is conveying the same message. The 25delta skew remains negative across all tenors, with the skew for a one-week tenor nearing extreme bearish levels. The premium for one-week puts is around 14%, indicating that traders are willing to pay a higher price for downside protection regardless of the spot price.
This behavior can create a self-fulfilling prophecy. When traders buy these put options, dealers often end up holding short positions. To hedge this risk, they sell futures or perpetual contracts. This selling pressure can further exacerbate market stress and potentially amplify the softening trend traders are trying to hedge against.
The yield curve for long-term bonds also tilts bearishly, but to a lesser extent. The yield curve for a six-month tenor is slightly below 5%, indicating that market concerns are primarily focused on short-term bonds rather than the entire tenor range.
Demand for Downside Protection
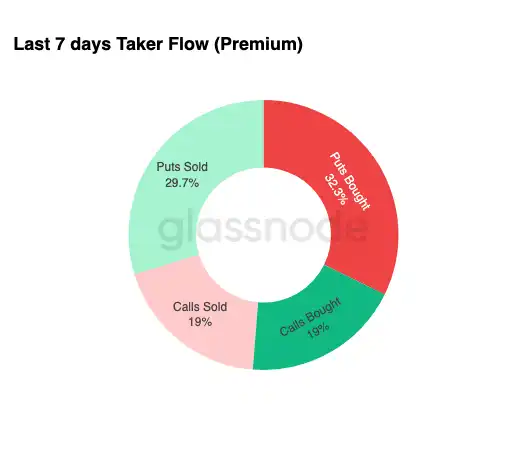
From market dislocation to actual trading activity, the trading volume over the past seven days has also confirmed a similar pattern. Traders have bought a significant amount of put option premium, far exceeding the demand for call options. This aligns with hedging behavior, reflecting that traders are more inclined to hedge against further market declines rather than bet on an increase.
The lackluster trading activity in call options further confirms that traders have not significantly increased risk exposure before the year-end. Compared to the flow in put options, the buying and selling volumes of call options have remained at lower levels, supporting the view that caution rather than speculation is driving position changes.
Overall, this combination suggests that the market is preparing for volatility and is more inclined towards protection rather than risk-taking.
90K Strike Option Premium
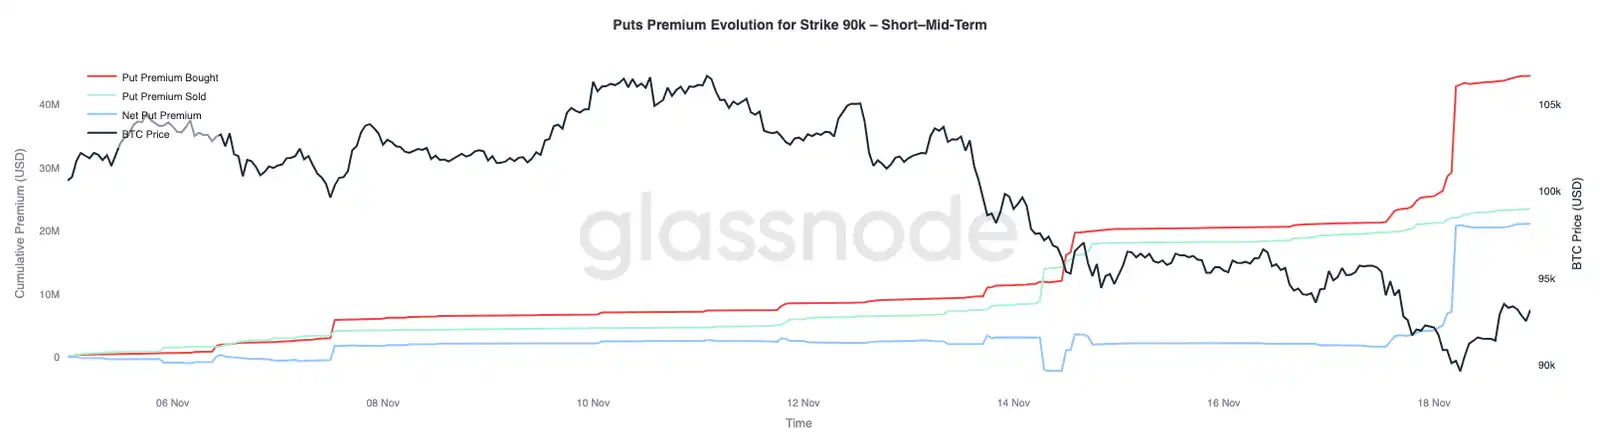
Building on overall fund flow data, the put option premium for the 90K strike shows that as prices weaken, protective demand accelerates. Over the past two weeks, the net put option premium for this strike has remained relatively balanced until Bitcoin broke below the $93,000 level. Once below this level, traders increased selling pressure on these put options, leading to a significant rise in the option premium for the 90K strike.
This behavior indicates that as spot pressure intensifies, traders are willing to pay an increasingly higher price to obtain downside protection. This move also aligns with the earlier rise in short-term implied volatility, as the concentrated demand at key strike prices often drives up the price of near-term contracts.
The sharp repricing of the 90K put option underscores how quickly downside hedging activity accelerates when key price levels are breached.
Pricing Market Fragility
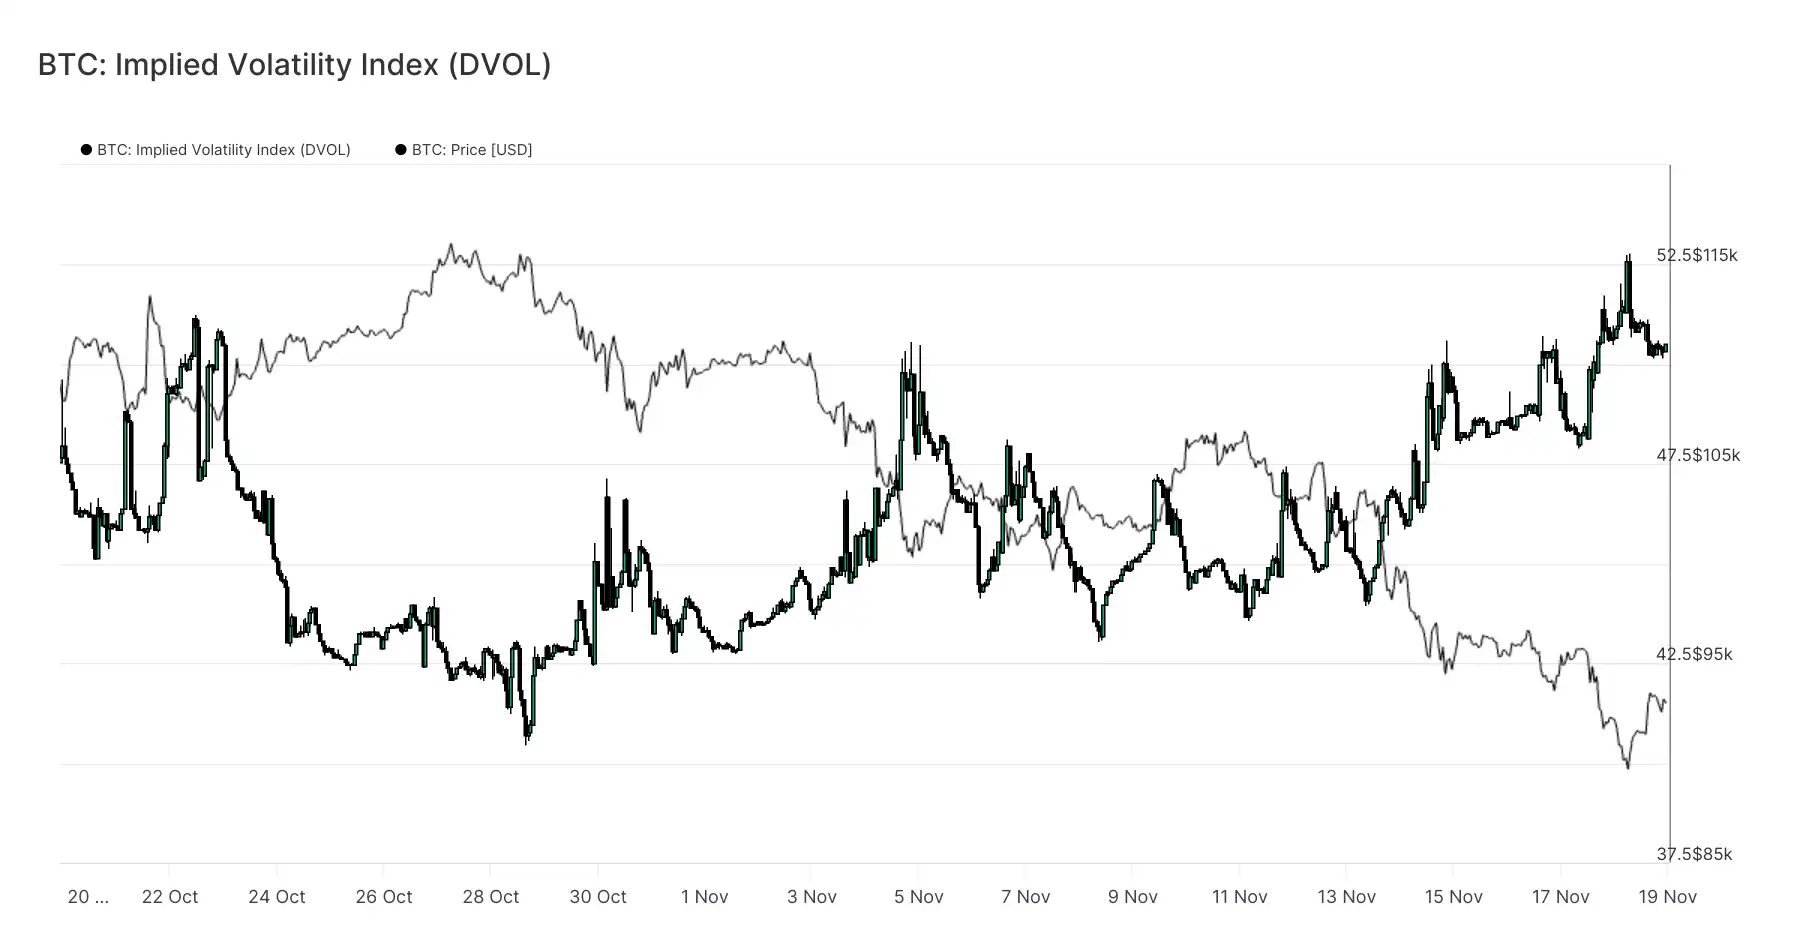
The DVOL index has shifted from individual option prices to a broader volatility gauge, reflecting the extent to which the market is repricing risk. The DVOL index, which approached 40 three weeks ago, has since rebounded to near its monthly high around 50. DVOL reflects the implied volatility of a basket of fixed-term options, so when the DVOL index rises, it indicates traders expect larger future price swings.
This uptick ties the overall trend in the options market together. Implied volatility across maturities is on the rise, skew remains negative, recent fund flows' delta is negative, and traders seem reluctant to increase risk heading into year-end. These factors collectively suggest the market is gearing up for significant price volatility. Key drivers include perpetual contract liquidation risk, macroeconomic uncertainty, and ETF inflows leading to weak spot demand.
The next event that could alter this volatility landscape is the Federal Open Market Committee (FOMC) meeting three weeks from now. Until then, the options market will continue to signal caution and clearly indicate a preference for hedging.
The rise in DVOL further confirms that the market is digesting expectations of greater future volatility, with traders preparing for market swings.
Conclusion
Bitcoin continues to navigate a challenging market phase characterized by a weak market structure, shrinking speculative demand, and a significant surge in derivatives market hedging sentiment.
Spot demand remains subdued, ETF inflows are negative, and the futures market shows no intention to leverage up in a weakened state.
Meanwhile, implied volatility, skew, and hedge fund flows all indicate heightened investor concerns over recent downside risks, with a willingness to pay an increasing premium for protection.
All these factors together form a market seeking stability, with its future direction hinging on whether demand can reemerge near key price levels or if the current fragility will evolve into a deeper retracement or bear market.
Disclaimer: The content of this article solely reflects the author's opinion and does not represent the platform in any capacity. This article is not intended to serve as a reference for making investment decisions.
You may also like
XRP price at risk of a 25% drop to $1.55: Here is why

Bitcoin downtrend accelerates, but traders eye short liquidity at $100K

MicroStrategy splurges $800 million, Harvard’s holdings surge 200%: Are whales bottom-fishing or is this the prelude to a bull trap?
MicroStrategy and Harvard University increased their positions against the trend during the bitcoin market correction—MicroStrategy purchased 8,178 bitcoins, and Harvard increased its holdings in BlackRock’s bitcoin ETF. The market shows a pattern of retail investors selling while institutions are buying, but the scale of institutional accumulation is difficult to offset the pressure from ETF capital outflows. Summary generated by Mars AI This summary was generated by the Mars AI model, and its accuracy and completeness are still being iteratively updated.

Rebuilding Order Amid Crypto Chaos: Where Will the Next Wave of Liquidity Come From?